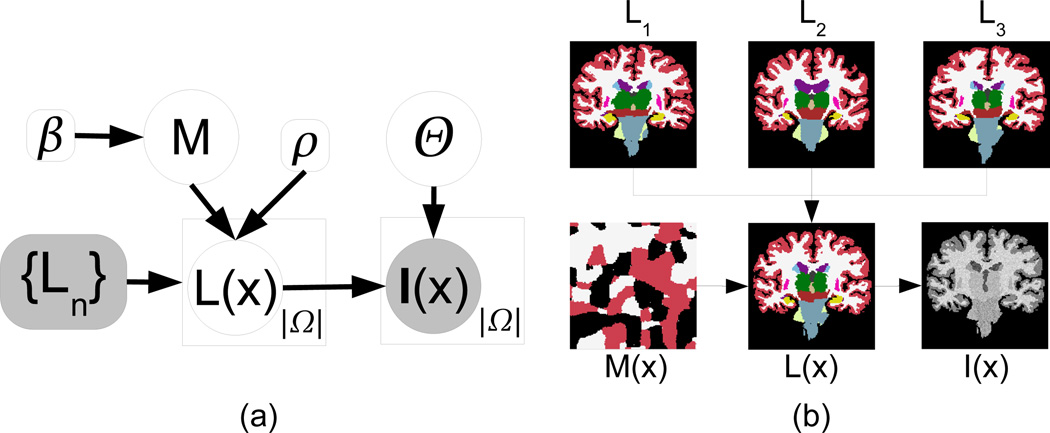
Fig. 1.
a) Graphical model of the image generation process. Random variables are in circles and constants are in boxes. Observed variables are shaded. Plates indicate replication. b) Illustration of the generative process: three deformed atlases are combined through the membership field M(x) to yield the labels L(x). The image intensities I(x) are obtained by sampling a Gaussian distribution for each label. We purposely chose the Gaussian parameters to make I(x) resemble a T1-weighted MRI scan.

