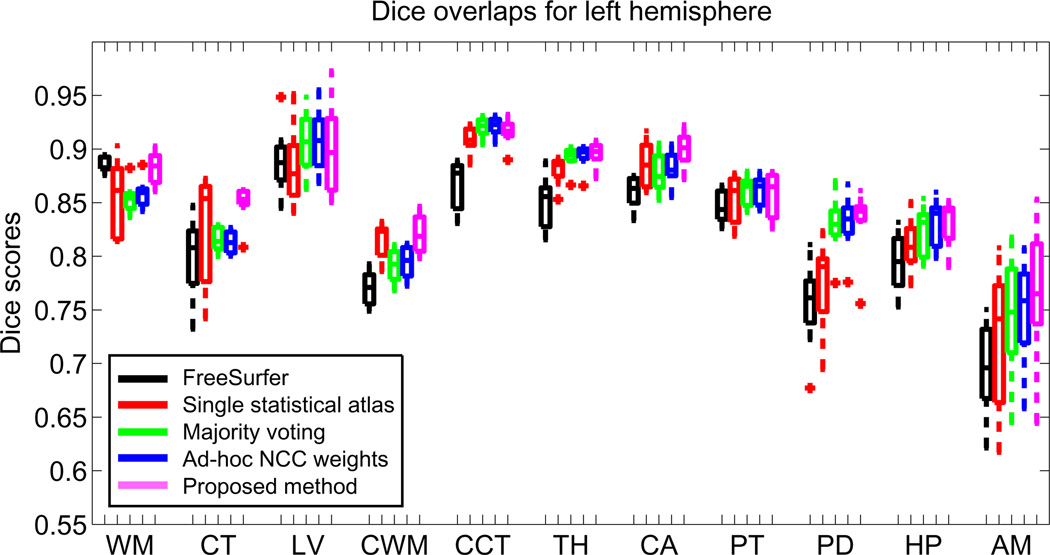
Fig. 2.
Boxplot of Dice overlap scores corresponding to the 11 structures of interest for the left hemisphere; see Section 3.1 for the abbreviations. Horizontal box lines indicate the three quartile values. Whiskers extend to the most extreme values within 1.5 times the interquartile range from the ends of the box. Samples beyond those points (outliers) are marked with crosses.

