Figure 2.
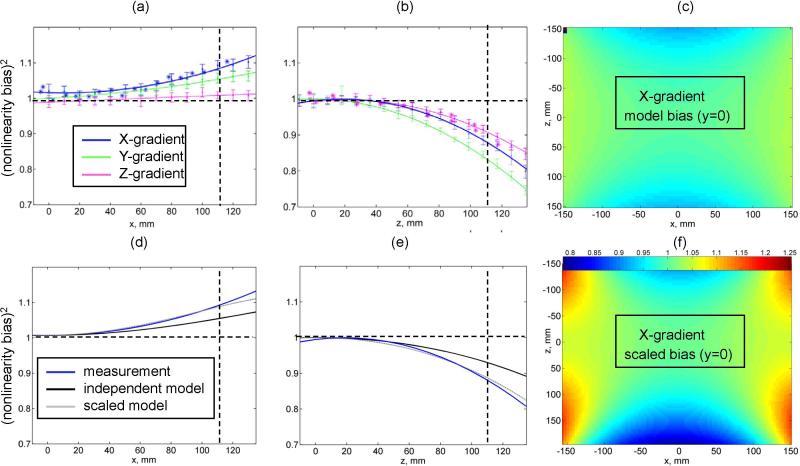
Measured ADC nonlinearity bias (ADCmeasured/ADCknown) for ice-water phantom is plotted for X (blue), Y(green) and Z(magenta) gradient coil as a function of right offset (a) and superior offset (b). Error bars correspond to a standard deviation over 10 mm diameter circular ROI (approx. 90 pixels). Solid lines correspond to quadratic fit for the measured bias. Asterisks mark results for geometric distortion measurements performed on a regular grid phantom along x (blue) and z (magenta) directions. Vertical scatter of asterisks near zero offset reflects the distortion measurement error (2-4%). Horizontal dashed lines mark expected value for linear gradients. Vertical lines at ~110mm offset mark the characteristic scalar measurement for gradient nonlinearity. (d) and (e) panes illustrate linear rescaling (dotted gray) of the independent model (black line) to the characteristic system scale (blue line) for X gradient coil. (f) shows results of 2D rescaling for independent model map in (c) at y=0 by characteristic z and x scalars measured from (d) and (e). Common nonlinearity range used for (f) and (c) maps is indicated by a color-bar.

