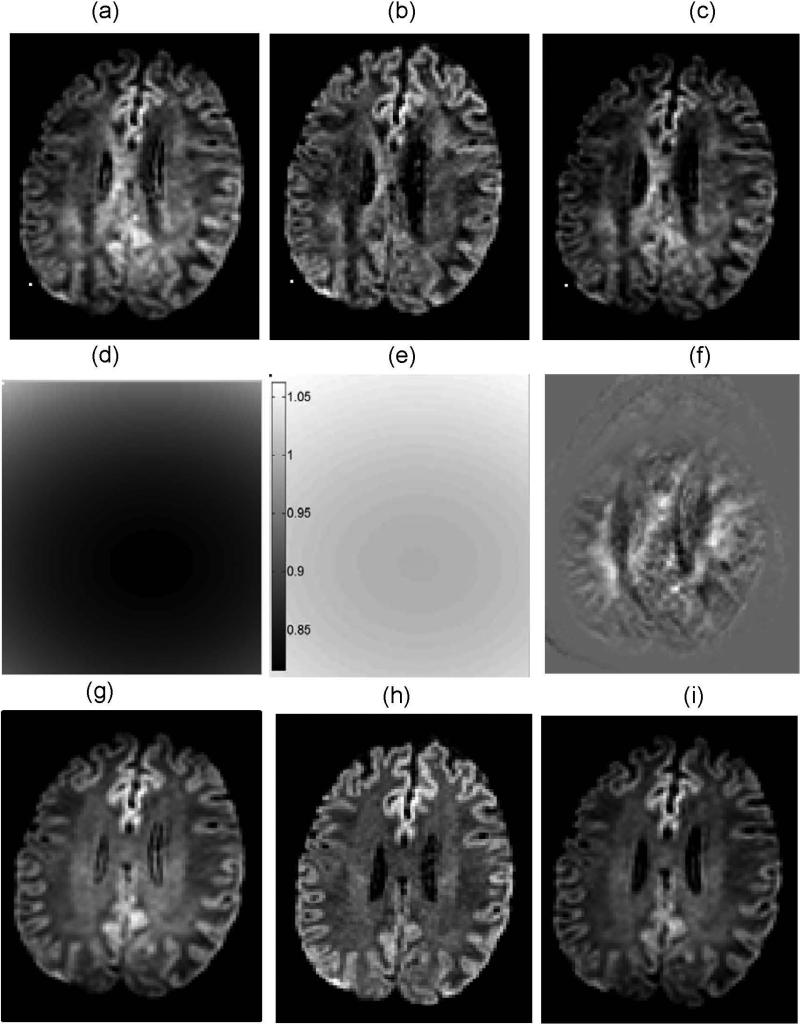
Figure 4.
DWI bias correction illustrated for a single slice through the brain anatomy for the first non-LAB DWI direction (a-c) and the trace image (g-i): (a,g) biased by underweighting at superior offset of z~130mm; (b,h) negligible bias for z~10mm; (c,i) corrected diffusion weighting for z~130mm; (d) 2D corrector (bias) map corresponding to (a); (e) 2D corrector (bias) map for (b); (f) difference between trace DWI corrected for individual directions (i) and single “average corrector” trace image (not shown). Positive difference in (f) is illustrated by pixels brighter than (zero) background outside of the brain. Magnitude images are plotted for all panes but (f), with black color corresponding to zero-magnitude. Same window leveling is used for DWI (a-c) and (g-i). (d) and (e) share the same gray-scale bar.

