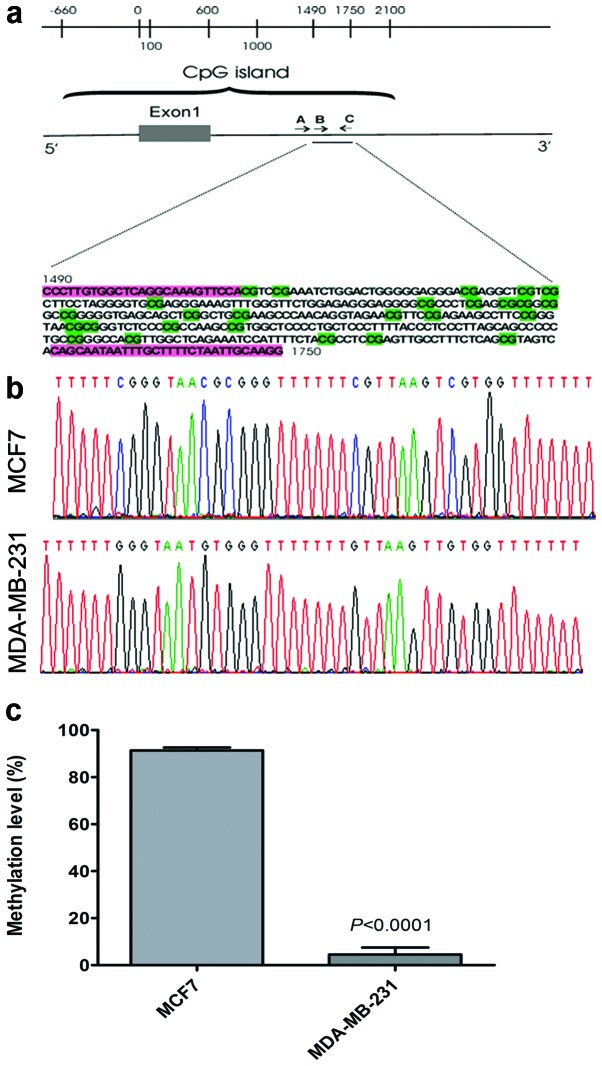
Figure 2.
The genomic configuration of the CHST11 gene and methylation of CPG island in MCF7 and MDA-MB-231 cells. (a) Exon 1 from NCBI NM_018413.5 is shown (0 to +616) as is the CpG island (between −660 and +2,100). The horizontal arrows indicate the approximate relative positions of bisulfite genomic sequencing primers for semi-nested PCR. Primer A is the outside forward primer (Table I), primer B is the nested forward primer (position +1,490 and Table I), and primer C is the reverse primer (position +1,750 and Table I). The genomic sequence (pre-bisulfite) between the B and C primers is shown below the map and B and C primer locations are highlighted in pink. The scale is in base pairs. (b) Sections of bisulfite genomic sequencing electropherograms showing part of the CHST11 CpG island. Top, DNA of MCF-7 cells. In this top electropherogram most CpG sites have prominent cytosine (C) peaks because methylated cytosines are not changed to thymines (Ts) in the bisulfite reaction. Bottom, DNA of MDA-MB-231 cells. In this section CpG sites appear as TpG sites and are in the same sequence positions as the top CpGs. In this bottom electropherogram most CpG sites have prominent T peaks because unmethylated Cs are changed to uracils in the bisulfite reaction. (c) Quantification of methylation levels of the CpG island in MCF7 and MDA-MB-231 cells. Methylation levels were averaged >10 CpGs and 18 preparations for MCF7 and 16 preparations for MDA-MB-231 cells. Means and SEM are shown. Data were Arcsin transformed and subjected to the Mann-Whitney U test to compare means.

