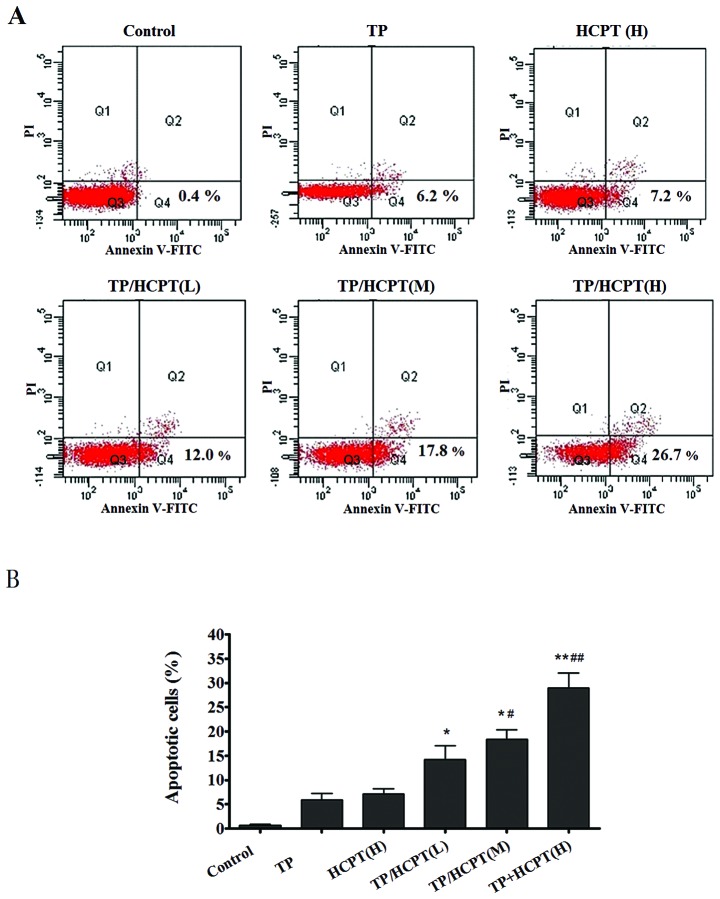
Figure 3.
Effect of TP and HCPT combination treatment on the induction of apoptosis. (A) Flow cytometry analyses of A549 cells under various treatments using double staining with Annexin V (horizontal line) and propidium iodide (PI, vertical line); TP, 25 ng/ml TP; HCPT(H), 4 μg/ml HCPT; TP/HCPT(L), 25 ng/ml TP + 1 μg/ml HCPT; TP/HCPT(M), 25 ng/ml TP + 2 μg/ml HCPT; TP/HCPT(H), 25 ng/ml TP + 4 μg/ml HCPT. (B) Bar graphs representing the proportion of early stage apoptosis cells (Annexin V-positive/PI-negative). Data are expressed as the means ± SE (n=3). *p<0.05 and **p<0.01 vs. TP group; #p<0.05 and ##p<0.01 vs. HCPT group.

