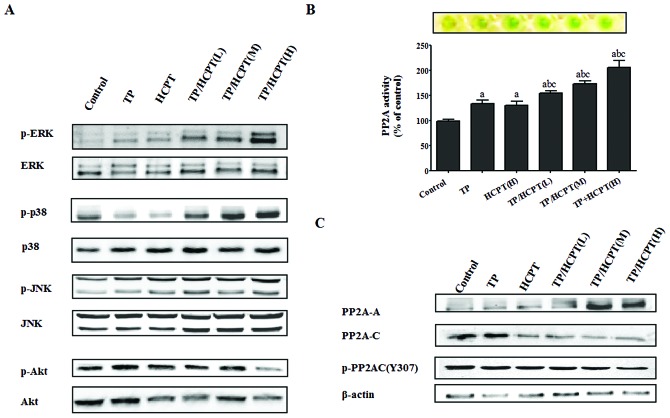
Figure 5.
Effect of TP/HCPT treatment on the MAPKs and Akt signaling pathways as well as PP2A activity in A549 cells. (A) The cell lysates from A549 cells under various treatments were subjected to immunoblot analysis with antibodies that detect either the specified protein or the specified protein when it is phosphorylated at a designated site, which are representative of at least 3 separate experiments. (B) Phosphatase activity of PP2A was determined with phosphatase assay system (see Materials and methods). The values are expressed as a percentage of the control (untreated cells; 100% PP2A activity). a, *p<0.05 vs. the control group; b, *p<0.05 vs. TP group; c, *p<0.05 vs. HCPT group (n=4). (C) Alterations of various PP2A subunit levels detected by antibodies against the PP2A-A subunit, PP2A-C subunit and phospho-PP2A Cα (Tyr307). β-actin was used as an internal control.

