. 2014 Nov 20;6(2):1237–1246. doi: 10.1039/c4sc01320d

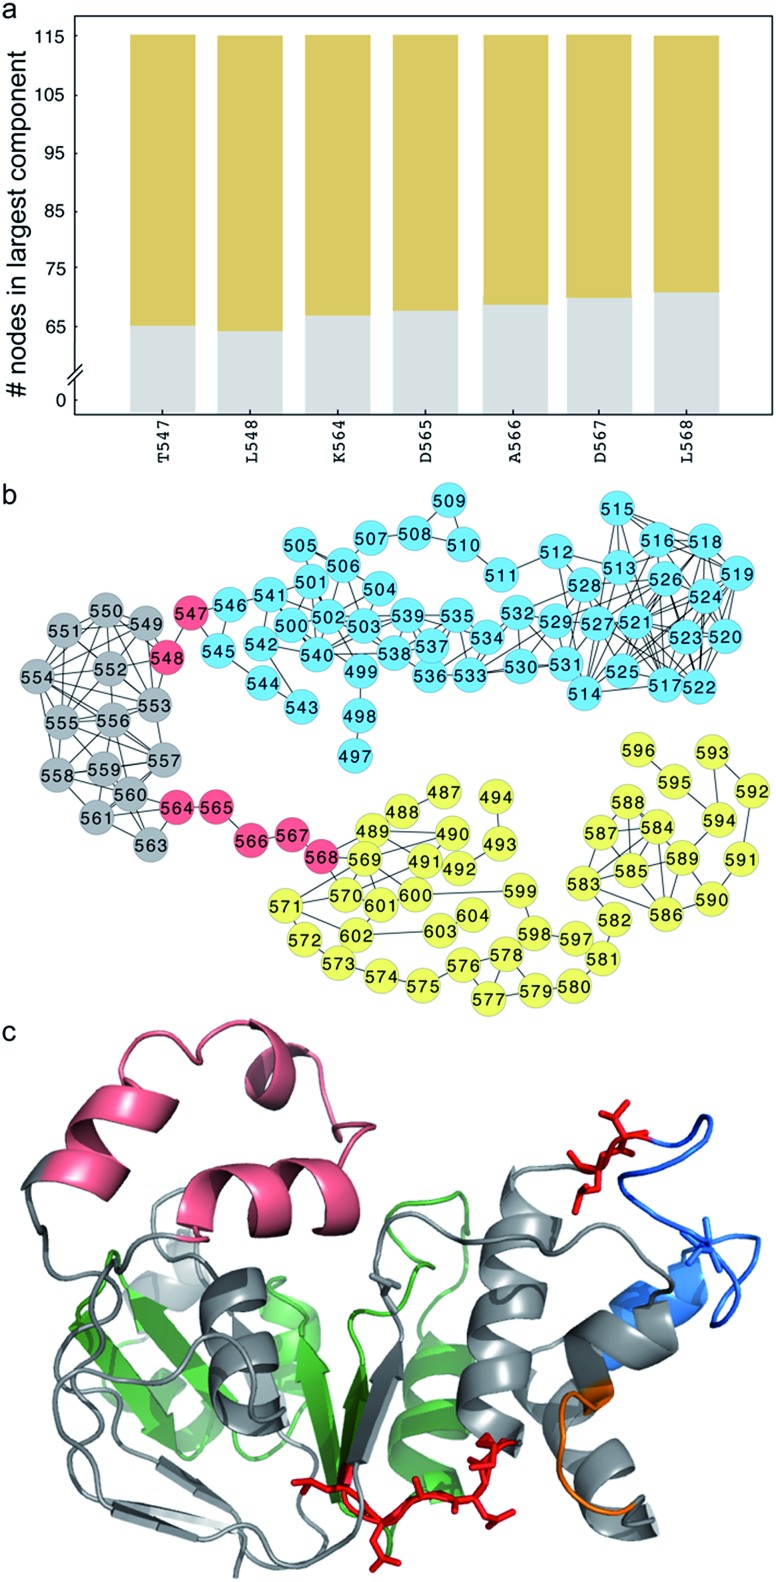
Fig. 3. Critical nodes connect the SDR and ATP-binding subdomain in ΔI507-NBD1. (a) Number of nodes in the largest component (y-axis) of the disconnected sub-graph after disconnecting the corresponding residue (x-axis). We consider residues that partition the sub-graph into connected components of ten or more residues as critical nodes. Different colors represent different components. (b) Network representation of the disconnected sub-graph. Several residues form critical nodes that partition the sub-graph into two connected components of nearly equal size (yellow and blue circles; grey circles represent nodes that switch components depending on which critical node is removed). (c) Structure of NBD1 with critical nodes highlighted in red stick representation. Color-coded by sub-structure, the RI is pink, ATP-binding subdomain is green, SDR is blue, and F508 loop is orange. I539 (blue) and S492 (grey) are highlighted in stick representation.

Fig. 3