
Figure 1. Confirmation of loss of HV1 expression in mutant rats.
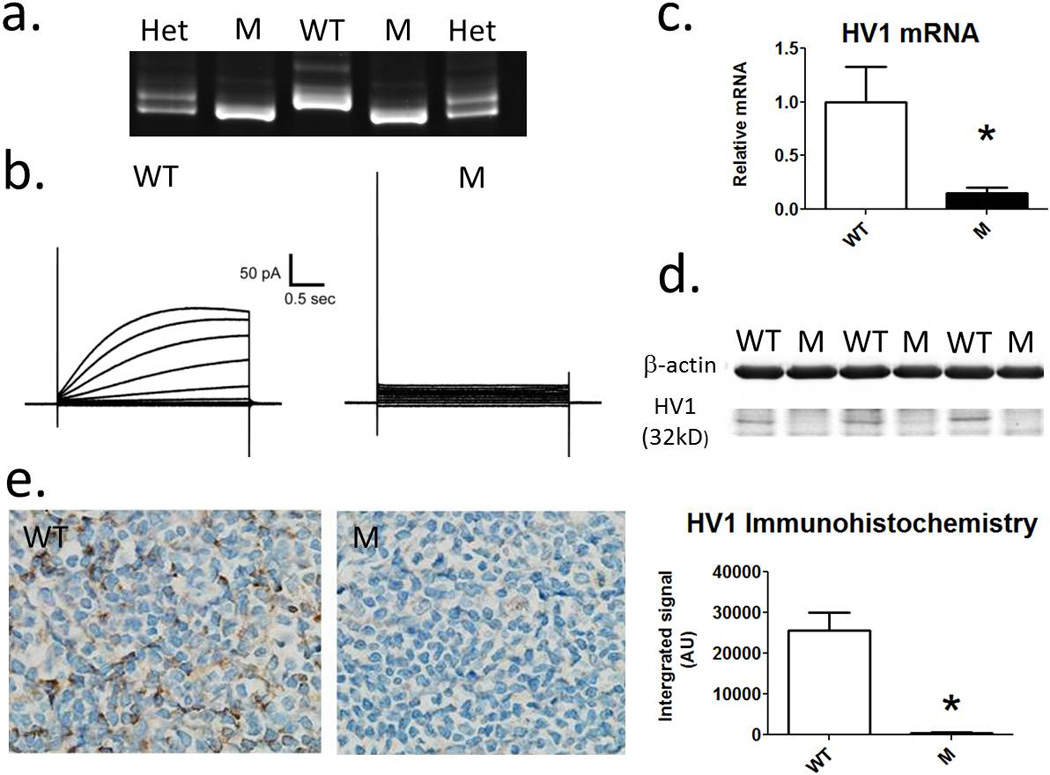
a) Representative gel for genotyping rats demonstrating 8bp deletion in gene encoding HV1. Lanes 1 and 5, heterozygous HV1−/+ mutants (Het); lanes 2 and 3, homozygous HV1−/− Mutants (M); Lane 3, Wild-type (WT). b) A representative trace demonstrating proton currents in response to step changes in membrane potential in single peritoneal macrophages from wild-type (right) and mutant (left) rats. c) relative HV1 mRNA expression from spleen homogenates from WT (open columns) and M (closed columns) rats compared to GAPDH mRNA (n=4). d) Western blot for HV1 in membrane fraction of WT and M rats. A band representing HV1 is shown at ~32kd. e) Immunohistochemical staining of spleen using anti-HV1 in WT and M rats (n=4). Left, representative image of anti-HV1 stained tissue from WT and M rats at 40X. Right, quantification of anti-HV1 staining (integrated signal (arbitrary units (AU)). * = p<0.05 using unpaired t-test. Data are mean±SE.