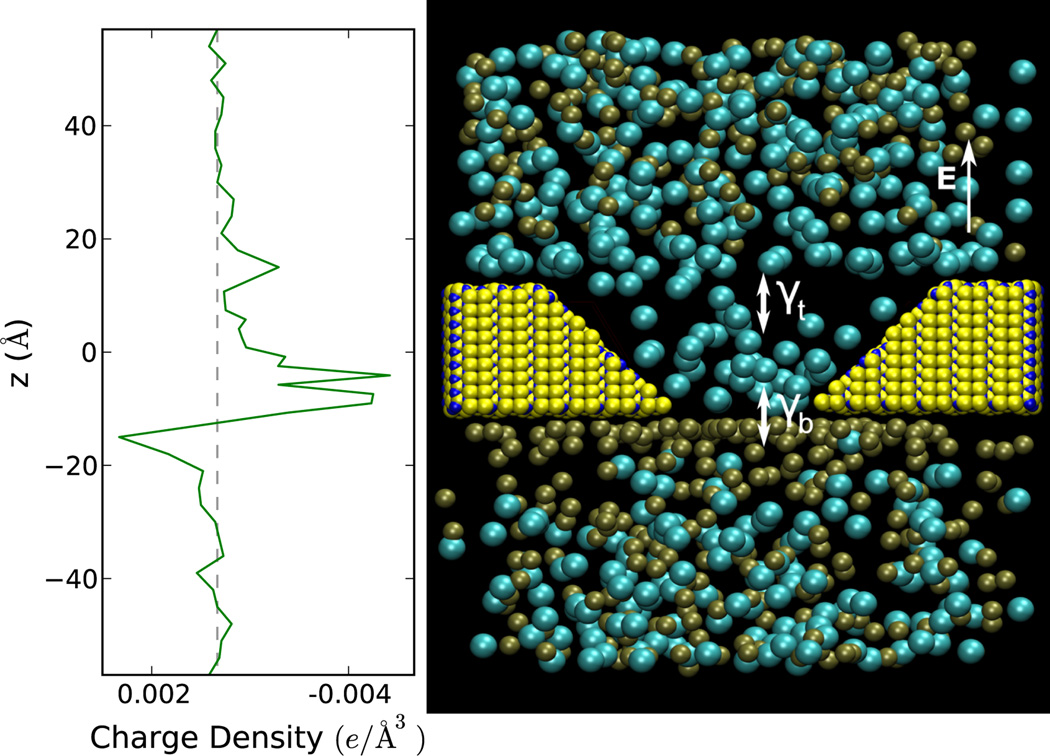
Figure 1.
(Color online) Right panel: a snapshot of a molecular dynamics simulation of 1M KCl solution subject to an electric field and translocating through a cone-shaped Si3N4 pore (indicated by the yellow and blue atoms) at a pore slope angle of 45° with a bottom opening of 7 Å radius and thickness of 25 Å. Cl− ions and K+ ions are colored aqua and brown, respectively. The symbols γt and γb indicate the rates of ion transfer at the bottom and top openings, respectively. The field used to generate this figure is 5.0 kcal=(molÅe) which allows an easier visualization of the ions build-up. Left panel: the net charge density obtained by dividing the net charge, in 3 Å thick volume slices, by that volume. This charge density corresponds to the right panel configuration. It is clear that in this case there is an accumulation of Cl− ions inside the pore while the K+ ions are located mostly outside the pore.

