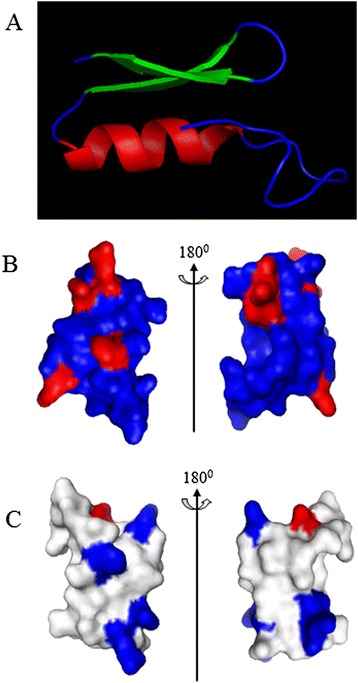
Figure 7.

Homology modeling of Siba Def. (A) Representation of the homology-derived solution structure of SibaDef. It consists of one α-helix (in red), two antiparallel β-sheets (in green) and some random coils (in blue). (B) Basic residues (Lys and Arg, in red) are displayed in the structures. (C) Electrostatic potential map of SibaDef, positively charged region and negatively charged region are shown in blue and red, respectively. Homology model was performed by Easymodeller version2.0 and optimized by using PYMOL software.
