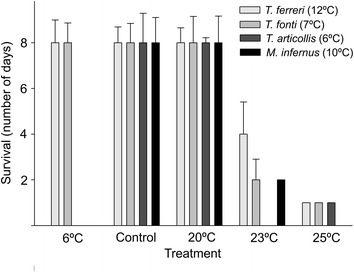
Figure 3.

Survival at different temperatures in the long term experiments. Bars show the median survival, and lines the standard deviation of the average. When specimens were alive at the end of the 7-day experiment, their survival was scored as 8. In brackets, temperature of the control of the respective species.
