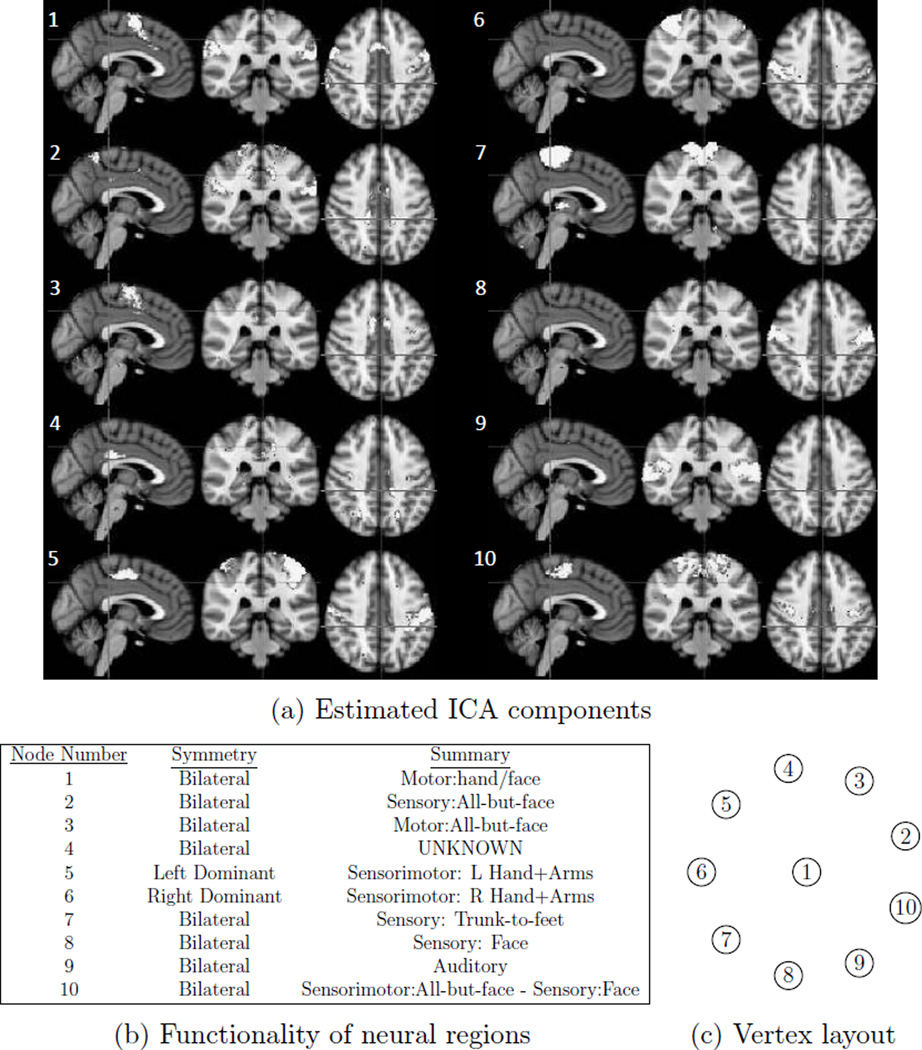
Figure 1.
Illustrative resting-state fMRI dataset. We consider 10 spatial modes obtained using ICA, show in (a) and described in (b), each having a corresponding time series for each subject. All graphs that we present will adopt the vertex layout shown in (c). [A colour version of this figure is available in the online supplemental material.]

