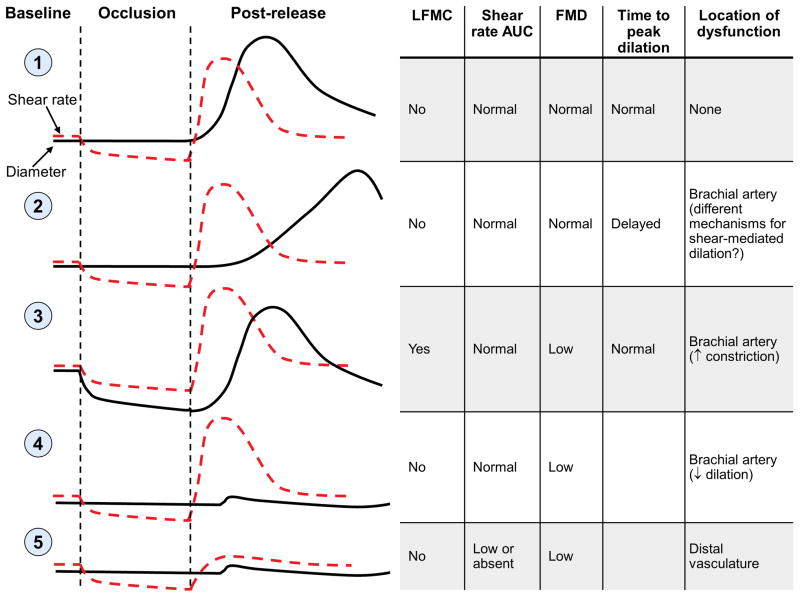
Figure 3. Using FMD, LFMC and shear rate AUC to gain more insight into the nature and location of vascular dysfunction.
Profile 1 shows expected responses in the brachial artery of a healthy subject, when FMD is measured above the occlusion cuff. Profiles 2-5 show multiple pathways that could potentially result in low FMD. The pathways and evidence supporting each are described in detail in the text.

