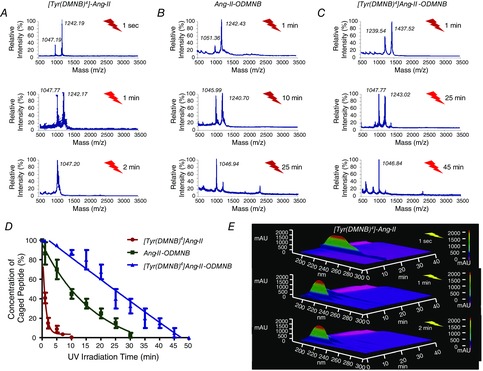
Figure 3. Photolysis kinetics of various analogues.

Photolysis (100-W UV-lamp) of a 10−8 m solution of (A) [Tyr(DMNB)4]Ang-II, (B) Ang-II-ODMNB and (C) [Tyr(DMNB)4]Ang-II-ODMNB was performed in Krebs–Henseleit buffer and analysed by mass spectrometry (n = 3 per group). D, caged peptide concentration over time after UV-irradiation. E, signal-intensity (Y-axis) versus wavelength (X-axis) and HPLC elution-time (Z-axis) at different times after photorelease of [Tyr(DMNB)4]Ang-II as analysed by analytical HPLC.
