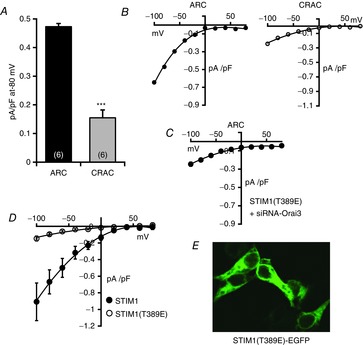
Figure 3. Effect of the T389E mutation in STIM1 on CRAC and ARC channel currents.

A, mean (±SEM) inward ARC channel and CRAC channel currents measured at −80 mV in cells expressing the STIM1-Δ448 construct bearing the T389E mutation. Values are mean ± SEM with values of n (number of cells) shown in parentheses. ***P < 0.0001 as indicated by Student's unpaired two-tailed t test. B, representative current–voltage relationships for the corresponding ARC channel currents (left), and CRAC channel currents (right). C, mean current–voltage relation for ARC channel currents in cells expressing the phosphomimetic STIM1(T389E) after knockdown of endogenous STIM1 and Orai3. Values are mean (±SEM), n = 6. D, mean (±SEM) current–voltage relation for CRAC channel in cells expressing full-length STIM1 (filled circles, n = 4), and a full-length STIM1 construct bearing the T389E mutation (open circles, n = 4). E, representative image showing the cytosolic distribution of an expressed fluorescently tagged STIM1 bearing the T389E mutation.
