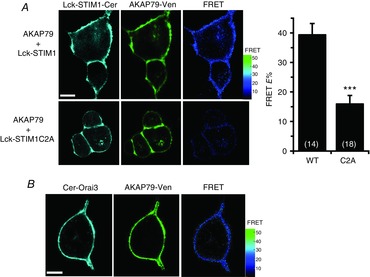
Figure 6. FRET between AKAP79 and Lck-STIM1-Δ448, and between AKAP79 and Orai3.

A, top row, representative images of cells co-expressing Lck-STIM1-Δ448 and AKAP79 constructs bearing C-terminal Cerulean and Venus tags, respectively, together with the resulting FRET signal (right); bottom row, corresponding representative images for the same experiment except that the co-expressed Lck-STIM1-Δ448 construct carried the C2A mutations shown previously to prevent STIM1 oligomerization. Scale bars are 10 μm. Also shown are the mean (±SEM) of the corresponding FRET values. ***P < 0.0001 as indicated by Student's unpaired two-tailed t test. B, representative images of a cell co-expressing N-terminally Cerulean-tagged Orai3 and N-terminally Venus-tagged AKAP79, together with the resulting FRET image. Scale bar is 10 μm.
