
Figure 4. Effect of luminal perfusion of SCFA on duodenal HCO3− secretion.
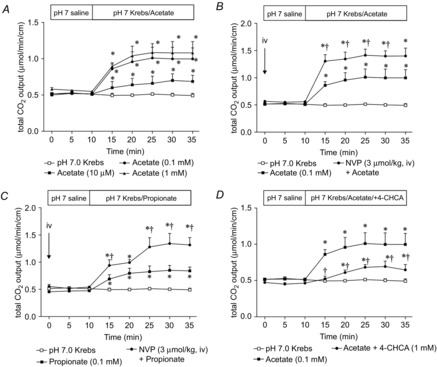
A, luminal perfusion of acetate (10 μm to 1 mm) dose-dependently increased HCO3− secretion. Each data point represents the mean ± SEM (n = 6 rats). *P < 0.05 vs. pH 7.0 Krebs group. B, C, luminal perfusion of acetate (B) or propionate (C) (0.1 mm) increased HCO3− secretion, with the effect enhanced by the DPPIV inhibitor NVP pretreatment (3 μmol kg−1, i.v.). Each data point represents the mean ± SEM (n = 6 rats). *P < 0.05 vs. pH 7.0 Krebs group. †P < 0.05 vs. SCFA group. D, co-perfusion of 4-CHCA (1 mm) reduced acetate-induced HCO3− secretion. Each data point represents the mean ± SEM (n = 6 rats). *P < 0.05 vs. pH 7.0 Krebs group. †P < 0.05 vs. Acetate group.