
Figure 5. Effect of luminal perfusion of FFA2 agonist on HCO3− secretion.
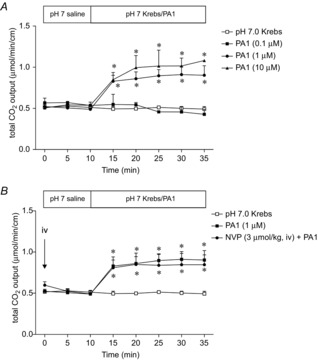
A, luminal perfusion of PA1 (0.1–10 μm) dose-dependently increased HCO3− secretion. Each data point represents the mean ± SEM (n = 6 rats). *P < 0.05 vs. pH 7.0 Krebs group. B, PA1 (1 μm)-induced HCO3− secretion was not affected by the DPPIV inhibitor NVP (3 μmol kg−1, i.v.). Each data point represents the mean ± SEM (n = 6 rats). *P < 0.05 vs. pH 7.0 Krebs group.