
Figure 4. Role of ILK in the EA.hy926 cell proliferation decrease induced by uraemic toxins.
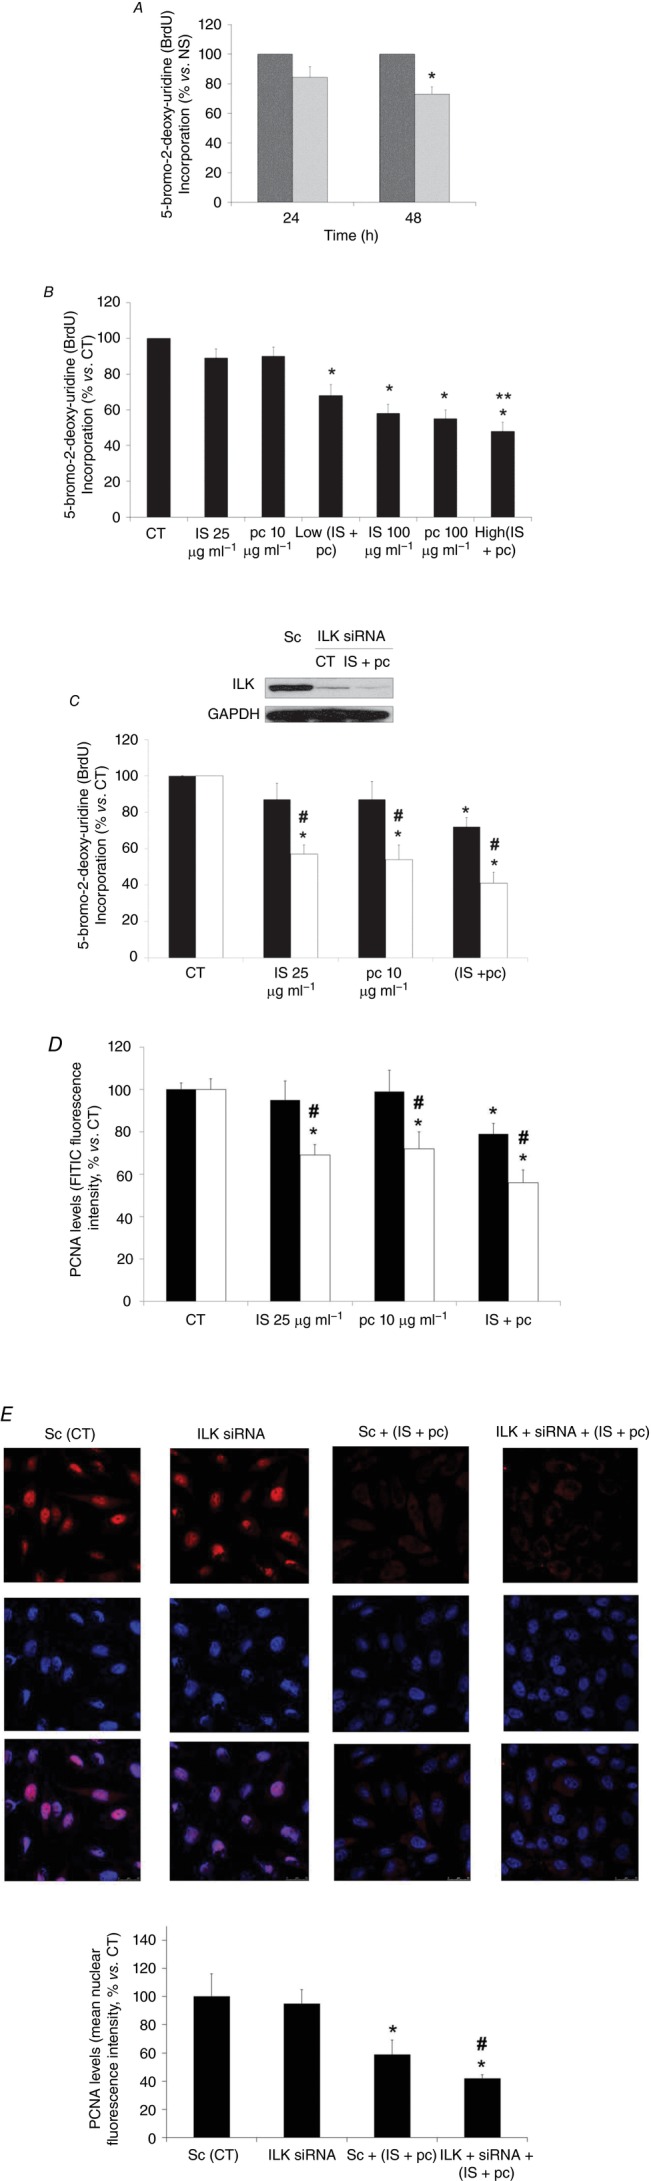
A, cells were incubated in medium supplemented with normal serum (NS, dark grey bars) (10%) or uraemic serum (light grey bars) (10%) for 24 and 48 h. B, cells were incubated in medium supplemented with 2.5% NS plus indoxyl sulfate (IS; 25 or 100 μg ml−1), p-cresol (pc; 10 or 100 μg ml−1), a combination of low concentrations of IS (25 μg ml−1) and pc (10 μg ml−1) (Low IS + pc) or plus a combination of high concentrations of IS (100 μg ml−1) and pc (100 μg ml−1) (High IS + pc) for 24 h. **P < 0.05 vs. Low (IS + pc). C and D, cells were depleted of ILK with specific siRNA (open bars) (100 nm) and treated afterwards with IS (25 μg ml−1), pc (10 μg ml−1) or both, for 24 h. Scrambled RNA (Sc) (filled bars) was used as control. After incubation, endothelial cell proliferation was measured by cytometric analysis of BrdU incorporation (C) or by cytometric analysis of PCNA expression levels, measured by fluorescence intensity of labelled cells with an FITC-conjugated antibody (D) and calculated as percentage of fluorescence intensity versus control (CT; 2.5% NS, 24 h). Data are expressed as mean ± SEM of six independent experiments. *P < 0.05 vs. control (CT; 2.5% NS, 24 h); #P < 0.05 vs. Sc. Representative Western blot of total ILK levels to check its depletion, and GAPDH levels as endogenous control are shown in C. E, after incubation as in C and D, nuclear PCNA expression (red) was determined by confocal microscopy. Nuclei were stained with DAPI (blue). A representative experiment is shown. Bar graphs represent the densitometric analysis of the fluorescence of 20 cells of six independent experiments. The results are expressed as a percentage of nuclear fluorescence intensity versus scrambled untreated control (Sc (CT); 2.5% NS, 24 h) and are the mean ± SEM of six different experiments. *P < 0.05 vs. Sc (CT); #P < 0.05 vs. Sc + (IS +pc).