Figure 2.

Ventialtory threshold and O2 uptake kinetics relationship with age
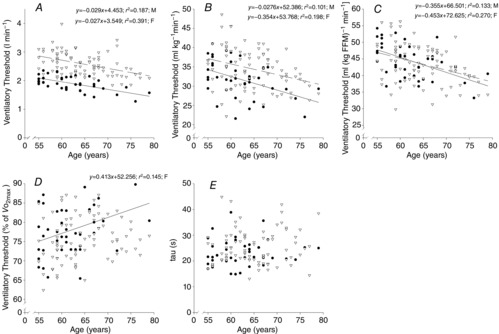
Ventilatory threshold (A–D) and O2 uptake kinetics (E) with age. Data are from females (• and continuous line) and males (∇ and dashed line).

Ventialtory threshold and O2 uptake kinetics relationship with age
Ventilatory threshold (A–D) and O2 uptake kinetics (E) with age. Data are from females (• and continuous line) and males (∇ and dashed line).