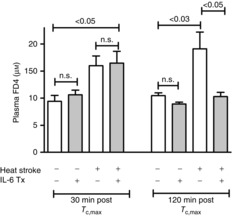
Figure 3. Effects of HS on the permeability of the intestine to high molecular weight FD4 gavaged into the gastrointestinal lumen.

The perpendicular brackets on the ends of the lines below the P values are directly over the corresponding groups that were found to be signficantly different by post hoc comparisons. Measurements were taken at 30 and 120 min after Tc,max. All experiments used the Tc clamp method. Shaded bars: IL-6 treatment. Values are means ± SEM, n = 5–7 per group. Signficance levels were from non-parametric tests following Kruskal–Wallis ANOVA (Steel–Dwass).
