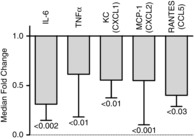
Figure 7. Secondary analyses of cytokine responses to IL-6 treatment during HS.

Values are medians–(bottom 25% quartile) calculated as a fold change of IL-6-treated HS over the mean value in untreated HS. P values are from a Wilcoxon test. The maximum FDR for all of these samples was < 0.15.
