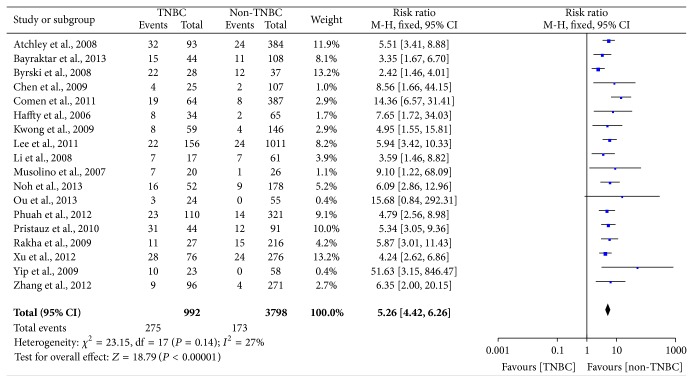
Figure 5.
Forest plot of studies evaluating RR of BRCA1 mutation in TNBC compared with non-TNBC. The events of TNBC and the events of non-TNBC refer to the number of TNBC patients with BRCA1 mutation and the number of non-TNBC patients with BRCA1 mutation, respectively. The squares and horizontal lines correspond to the specific RR and 95% CI for every study. The area of the squares reflects the study specific weight. The diamond stands for the pooled RR and 95% CI.

