
Figure 1.
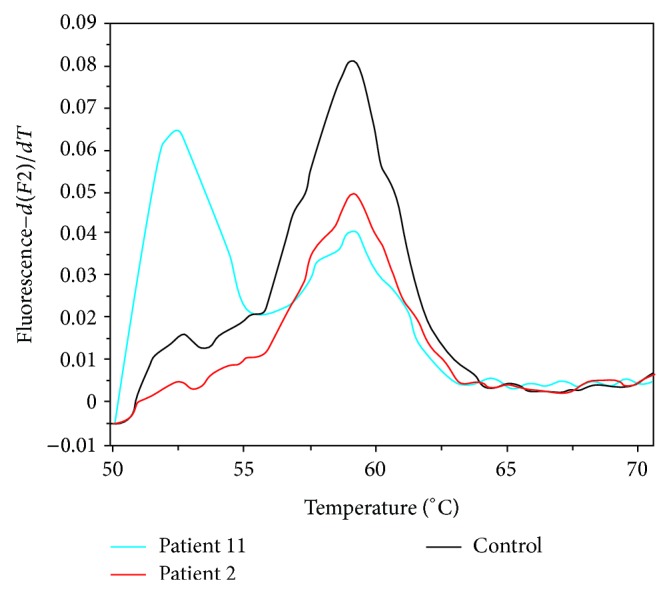
Fluorescent melting curve analysis for the detection of the BRAFV600E point mutation based on the resulting distinct melting temperatures (T m) of duplexes formed between the wild-type probe and the DNA from either the wild-type or the V600E mutant. The melting peaks for the wild-type and the V600E mutant occur at different melting temperatures, that is, 59.2°C and 52.5°C, respectively. The BRAFV600E mutation is shown for patient 11 (blue curve), whose tumor cells exhibit both types of BRAF alleles, since the PCR product shows also a wild-type peak. Patient 2 (red curve) lacks the mutation, exhibiting a single peak, corresponding to the normal control peak (black curve).