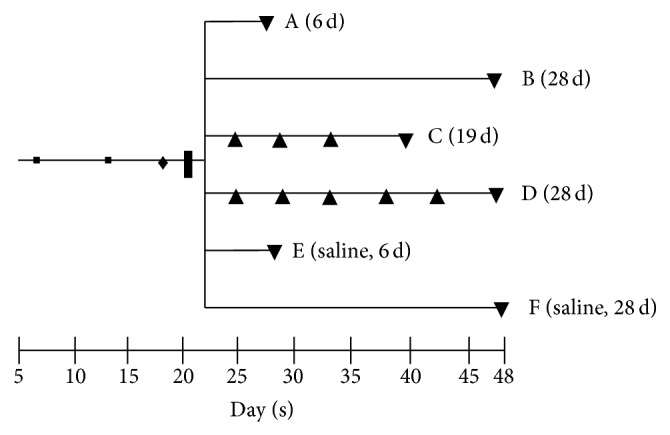
Figure 1.

Time line of RA rat model. 1st (■) and 2nd (■) immunization, DTH (♦), i.a. injection (❚), boost i.a. injections (▲), PET and/or, ex vivo tissue distribution, and (immuno-) histopathology of groups A (6 d), B (28 d), C (19 d), D (28 d), E (saline, 6 d), and F (saline, 28 d) (▼).
