
Fig. 9.
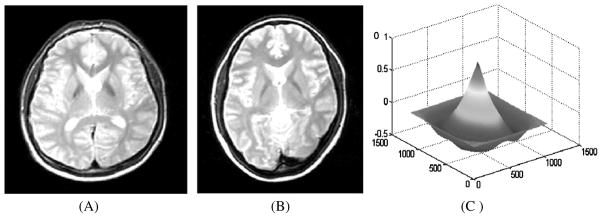
A) Transformed source image; B) Target image; C) Normalized cross-correlation (NCC) between the transformed source image and target image displayed as a surface plot. The peak of the cross-correlation matrix occurs when the images are best correlated [55].