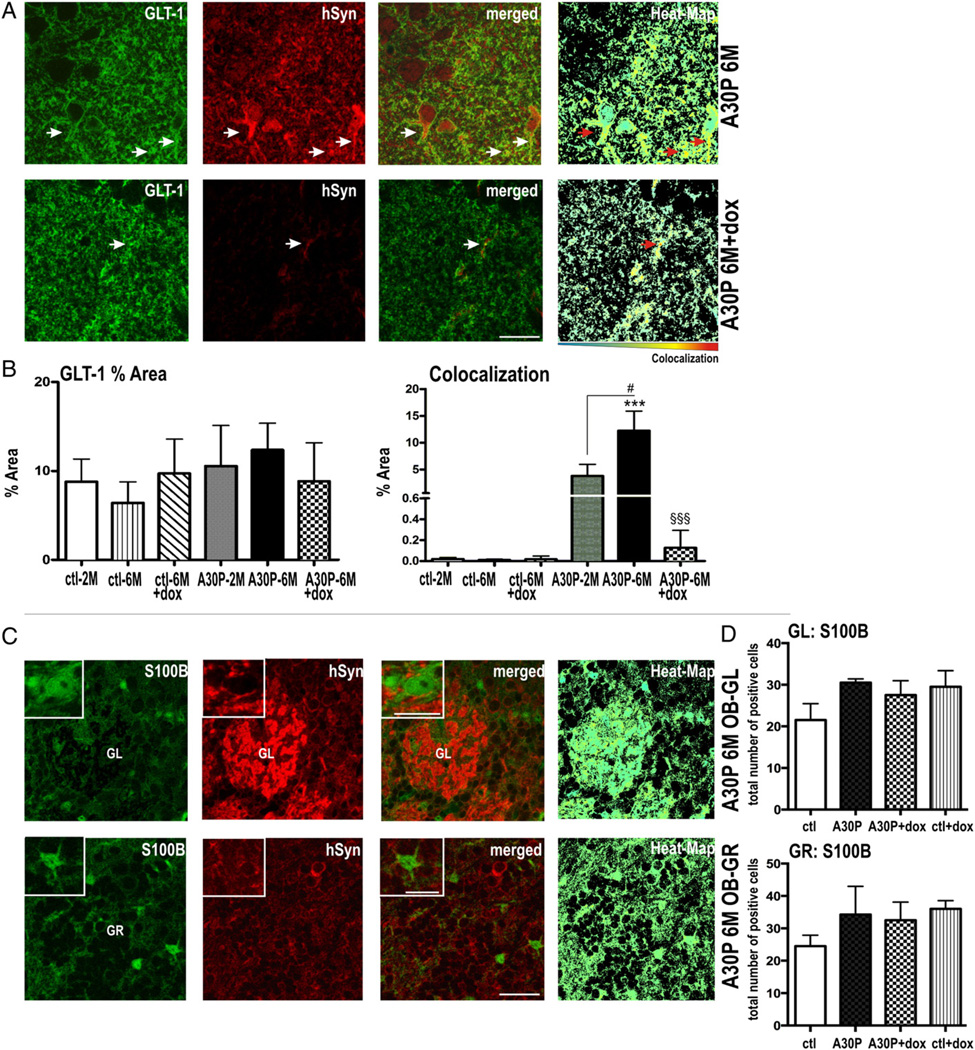
Fig. 7.
Site and compartment specific co-localization of human A30P α-syn assessed by S100B and GLT-1 co-staining in A30P mice. (A) Representative immunostaining for GLT-1 and human α-syn in the DG area of the hippocampus and (B) quantitated by percent of immunoreactive area Co-localization of GLT-1 (green) and α-syn (red) is shown in yellow fluorescence (arrows in merged) were also visualized by Col-Map plugin (Heat-Map). (C) Double labeling astrocytes with S100B (green) and α-syn (red) and (D) quantitation by stereological counts (per 10 sight-fields) did not show glial accumulation in OB. Data are present as mean + SEM. #p < 0.05 versus A30P-2 M, ***p < 0.001 versus ctl: §§§ p < 0.001 versus A30P-6 M. Scale bar: 25 µm in A, 30 µm in B and 10 µm in insets.

