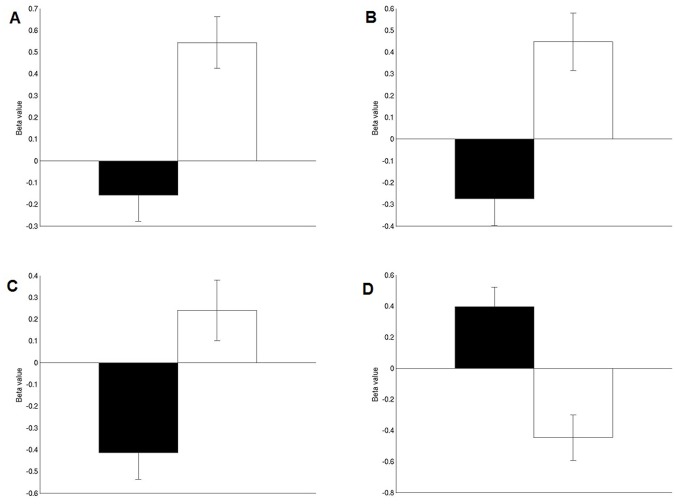
Fig 4. Bar plots showing mean activation levels (‘beta weights’) of each of the regressors (Mentalizing in black, Action in white) against baseline, in each of the regions found in the whole-brain analysis (Fig. 3).
A) left superior temporal gyrus. B) right superior temporal gyrus. C) posterior cingulate cortex. D) anterior medial prefrontal cortex. Error bars represent standard error of the mean (s.e.m.).

