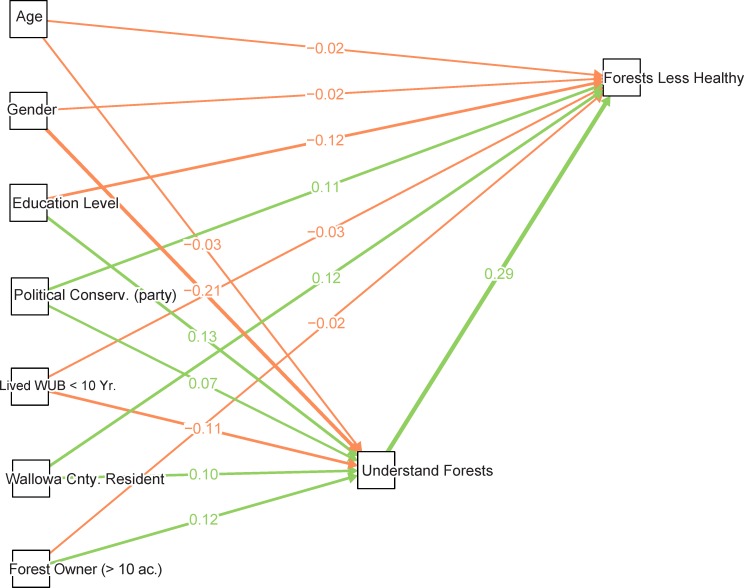
Fig 4. The path model that assesses relationships between forest understanding (Understand Forests), opinions about forest health (Forests Less Healthy) and various co-varying demographic indicators.
These correspond to three boxes of the conceptual model highlighted as the Telephone Survey Forest Condition (FC) model. Landowner Background in Fig. 2 is represented by the demographic and landowner characteristics covariates on the far left, Understanding is represented by Understand Forests and Perceptions of Risk is represented by Forests Less Healthy. The arrows represent the modeled connections between exogenous predictors and endogenous variables of interest, Understand Forests and Forests Less Healthy, with an exception that forest understanding is also specified as a predictor for forest health. The arrows point towards variables being regressed on (dependent) and numbers represent the total standardized coefficient estimates with color representing the sign of the association. Since connections represent standardized values the relative strength of the association is indicated by the weight of the edge.

