Figure 1.
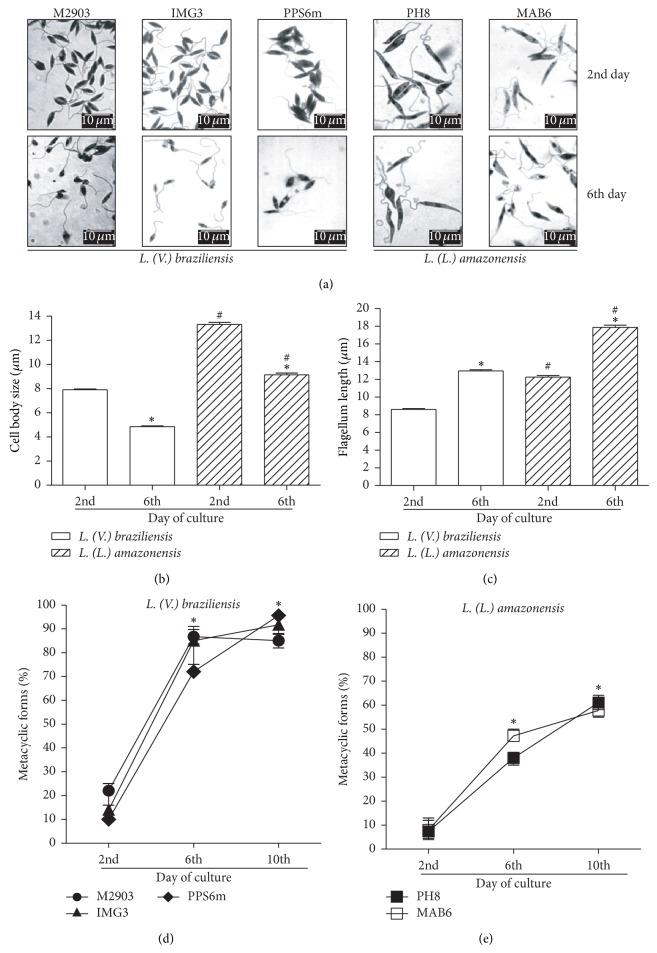
Metacyclogenesis as evaluated by morphometric analysis. Parasites in growth logarithmic phase were distributed into 24-well plates (5 × 10⁵ parasites/mL) in Grace's medium, at 26°C, in triplicates. (a) After 2 or 6 days, parasites (M2903, IMG3 and PPS6m, L. braziliensis; PH8 and MAB6, L. amazonensis) were fixed on slides, stained, and analyzed under a light microscope (1000x). Bar represents 10 μm. (b) Data show mean ± SEM of cell body size (μm); (c) data show mean ± SEM of flagellum length ((b) and (c)) open bars: L. braziliensis; hatched bars: L. amazonensis; measurements were obtained with the software image J (n = 300 parasites). * P < 0.05 (2nd versus 6th day); # P < 0.05 (L. braziliensis versus L. amazonensis). (d) and (e) percentages of metacyclic forms (flagellum/body ratio ≥ 2). Data represent median and minimal and maximal values of three independent experiments. * P < 0.05 (2nd versus 6th; 2nd versus 10th day).

