
Figure 2. Optimized conditions for an AD169IE2-YFP-based high-content screen.
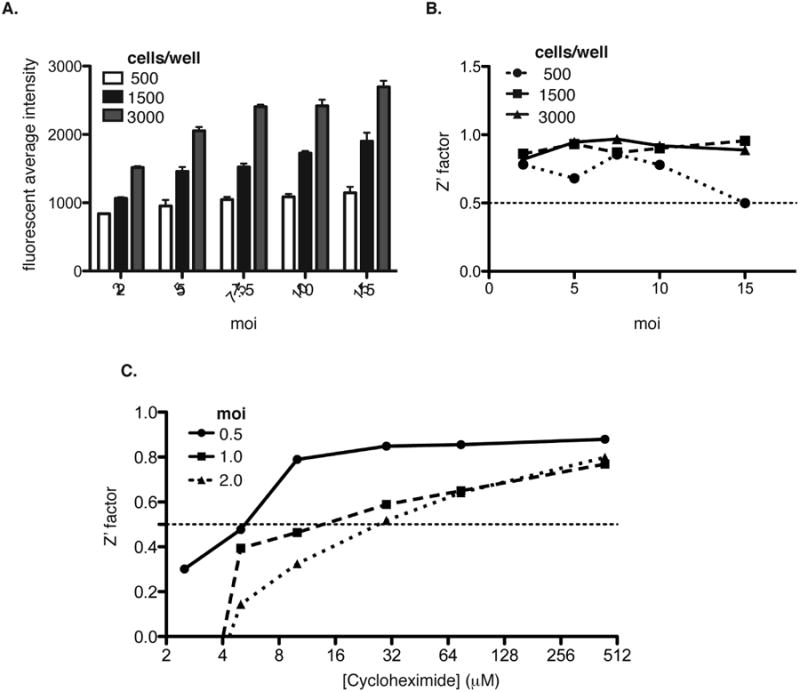
The fluorescent average intensity (A) was determined from 500 (white bars), 1500 (black bars), and 3000 (gray bars) MRC5 cells/well infected with AD169IE2-YFP at MOIs 2, 5, 7.5, 10 and 15. Error bars represent standard error of the mean of samples measured in quadruplicate. (B) The fluorescent intensity values were used to calculate the Z′ factor values for infection conditions of (A). (C) Z′ factor values were calculated using the fluorescence intensity values from MRC5 cells infected with AD169IE2-YFP at MOIs 0.5, 1.0, and 2.0 and treated with various concentrations (0-512 μM) of cycloheximide.