
Figure 3. High-content screen for identifying CMV inhibitors.
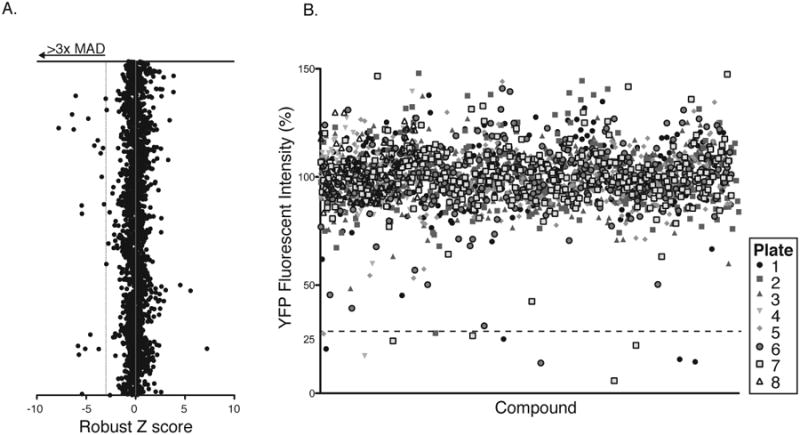
(A) The Robust Z-score was calculated from the fluorescence intensity MRC5 cells infected with AD169IE2-YFP-infected fibroblasts pretreated for each compound (X axis) and plotted against the chemical ID number (Y axis). Eighteen compounds reduced YFP expression >3 median absolute deviations beyond the mean score (dotted line). (B) Average YFP mean fluorescent intensity from MRC5 cells infected with AD169IE2-YFP-infected fibroblasts pretreated for each compound (2 replicates) was calculated into %YFP fluorescence intensity using DMSO treated cells as 100%. The %YFP fluorescence (Y axis) was plotted based on chemical ID number (X axis). Symbols represent the library plate that corresponds to each compound. The dotted line indicates the selected hit cutoff of 70% inhibition (30% infection).