
Figure 4. Determination of EC50 and CC50 values of representative hit compounds.
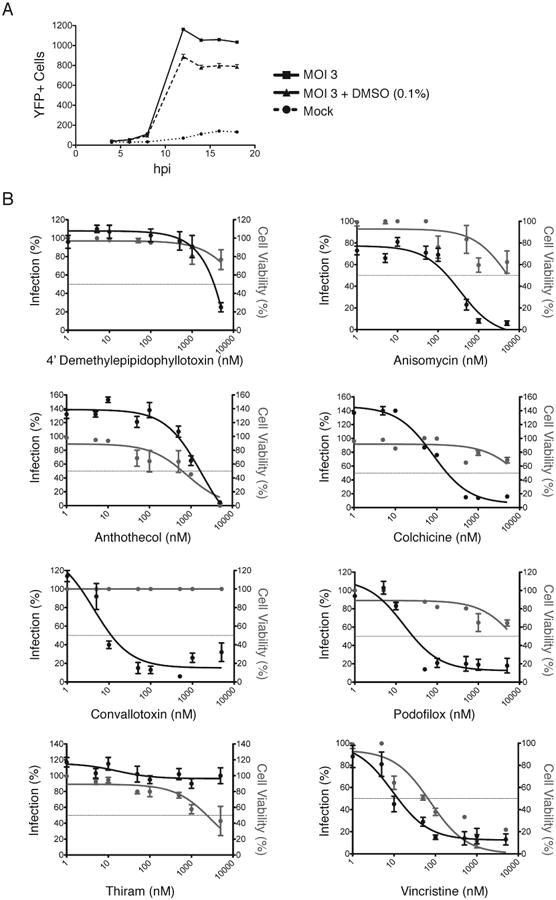
(A) Mock and AD169IE2-YFP-infected MRC5 cells (MOI:3) treated with or without DMSO were analyzed for fluorescence signal using an Acumen eX3 cytometer. The number of YFP+ cells/well was plotted over the course of infection (18hpi). (B) MRC5 cells treated with DMSO and increasing amounts of hit compounds (0-5 μM) were infected with AD169IE2-YFP (MOI:3) and subjected to analysis using an Acumen eX3 cytometer for YFP+ cells. The % infection (left axis, black lines, filled circles) was determined based on the YFP+ cells from virus infected cells treated using DMSO treated cells as 100% infection. The intranuclear cell staining using NucGreen fluorescent cell dye (GFP + cells) was utilized to determine cell viability (right axis, gray lines and gray circles) with DMSO treated cells as 100% cell viability. Error bars represent standard error of the mean.