
Figure 7. Analysis of CMV infection following long-term convallatoxin treatment.
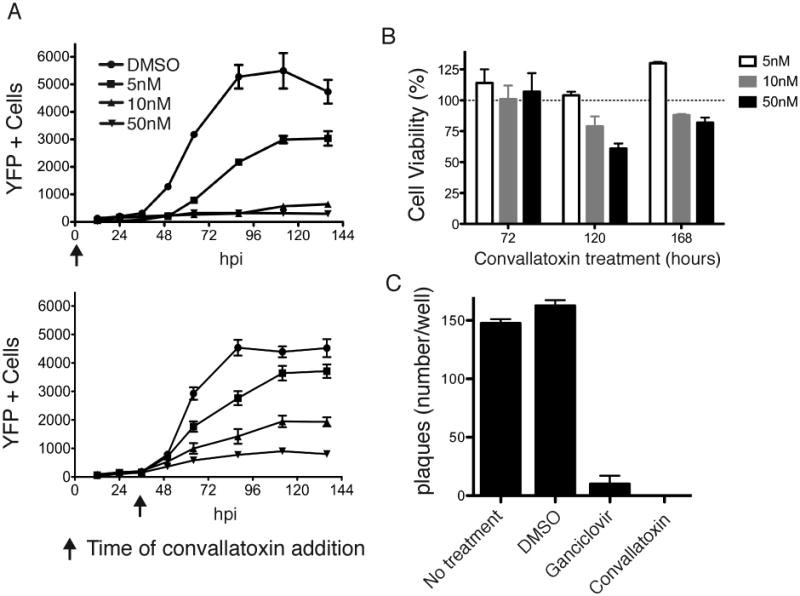
(A) The number of YFP+ cells (left axis, black lines) were analyzed from MRC5 cells treated with convallatoxin (5, 10, or 50nM) at time of infection (top panel) or 36 hpi (bottom panel) for up to 136hpi. (B) MRC5 cells were exposed to 5, 10, or 50nM convallatoxin for up to 168 hours. Using the total number of cells treated with DMSO as 100% cell viability, the % cell viability of convallatoxin-treated MRC5 cells was plotted for 72, 120, and 168 hpi. Error bars represent standard error of the mean. (C) MRC5 cells untreated or pretreated with DMSO, ganciclovir (12μM), or convallatoxin (5nM) were infected with AD169-WT (MOI: 0.002). The cells were subjected to a viral plaque assay 5 dpi. Error bars represent standard error of the mean.