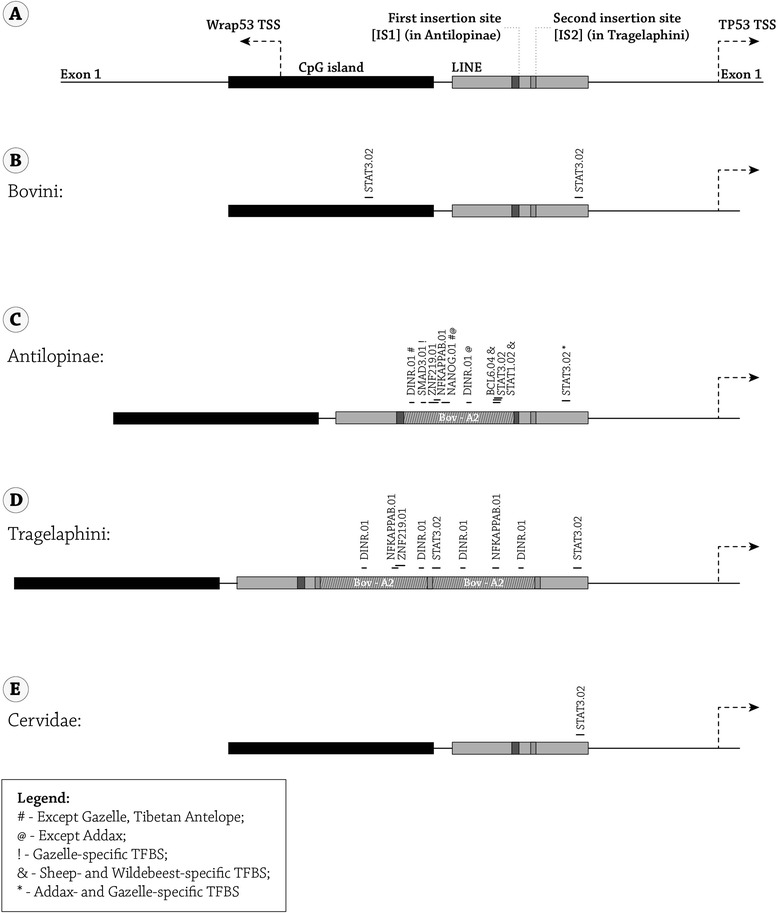
Figure 5.

Transcription factor binding site (TFBS) analysis was performed using the Genomatix Genome Analyzer (GGA) program ( https://www.genomatix.de/solutions/genomatix-genome-analyzer.html ). (A) A schematic representation of the of the TP53 P1 promoter genomic region in cow, including the full wrap53 exon 1 until the full TP53 exon 1. (B-E) The actual sequence that was analyzed in (B) Bovini, (C) Antilopinae, (D) Tragelaphini, and (E) Cervidae included the full CpG island until 50 bp in TP53 exon 1. The location and boundaries of each Bov-A2 element are indicated. The position and size of the unique TFBS are indicated. Abbreviations: TSS- Transcription start site, IS1- Insertion site 1, IS2- insertion site 2.
