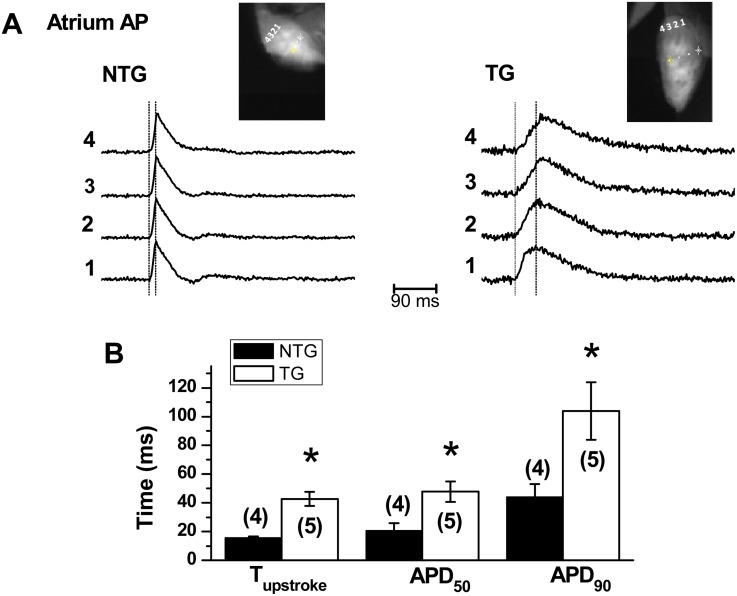
Fig 4. Optical APs recorded from right atria of six-month old TG and NTG mice hearts.
(A) Representative traces recorded from the location points 1–4, respectively as indicated in the inset. The average upstroke period was indicated by the two vertical dashed lines in each panel. (B) Summarized values of upstroke time and AP duration at 50% (APD50) and 90% (APD90). *indicates the significant difference between TG and NTG groups (p<0.05).

