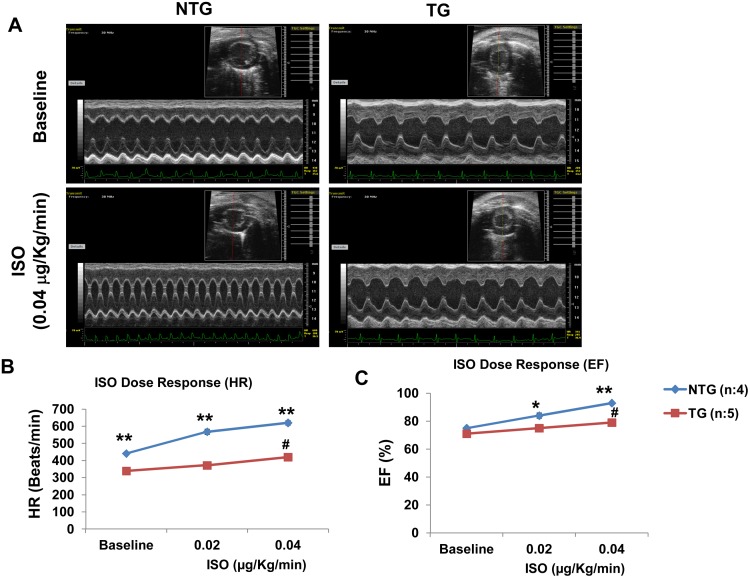
Fig 5. TG mice hearts show decreased ISO response.
(A) Representative M-mode echocardiographic images of the left ventricle in NTG and TG mice at baseline and post ISO (0.04μg/Kg/min) infusion. (B) Dose response curves showing the changes in heart rate (HR) and (C) ejection fraction (EF) after infusion of ISO at 0.02 and 0.04 μg/Kg/min in the TG and NTG mice. *NTG vs. TG; p<0.05, ** NTG vs. TG; p<0.005, #baseline vs. ISO (0.04 μg); p<0.05.

