Figure 7.

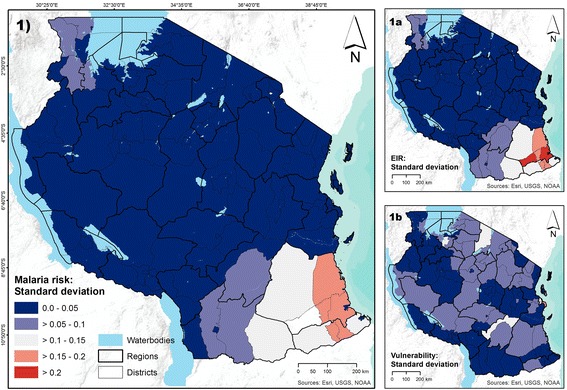
Standard deviation in district values of malaria risk and its two components. Panel 1 shows the variability in malaria risk. Panels 1a and 1b show the variability in the two components of malaria risk (i.e., EIR and vulnerability).

Standard deviation in district values of malaria risk and its two components. Panel 1 shows the variability in malaria risk. Panels 1a and 1b show the variability in the two components of malaria risk (i.e., EIR and vulnerability).