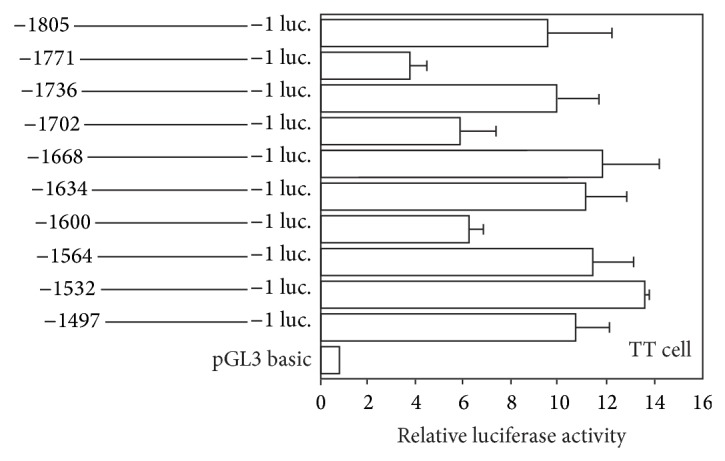
Figure 3.

Deletion analysis of the human ghrelin promoter. Relative luciferase activity in the area of −1805 to −1497 of the human ghrelin promoter was examined. Plasmids containing the human ghrelin promoter sequence ligated to the firefly luciferase were transiently transfected into TT cell. The schematic diagram represents the human ghrelin promoter activity in the each deletion constructs. Relative luciferase activity was the ratio of luciferase activity cotransfected with each expression vector versus pGL3 basic vector. The data represent the mean ± SE for triplicate samples. Statistically significant differences were calculated by relative luciferase activity in the area of −1805 to −1 as the standard. Asterisks indicate the differences between each group (P < 0.05).
