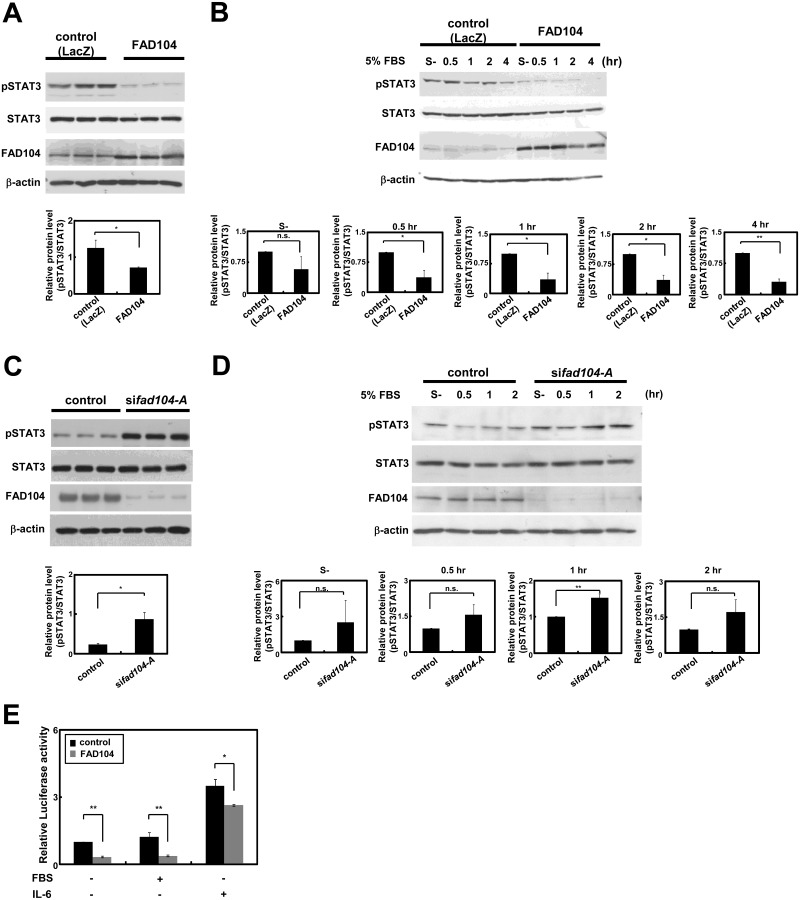
Fig 8. Fad104 negatively regulates the phosphorylation level of STAT3 in melanoma cells.
A, The phosphorylation level of STAT3 in A375SM cells over-expressing FAD104. The phosphorylation level of STAT3 and total protein level of STAT3 were detected by Western blotting (upper panel). 5 μg of protein was loaded per lane. β-actin expression was used as a control. Intensities of signals from phospho-STAT3 and total STAT3 were quantified by NIH-Image software. Quantification of the reduction rate of phospho-STAT3 was shown (lower panel). B, The phosphorylation level of STAT3 in A375SM cells infected with FAD104 after treatment with medium containing 5% FBS. At indicated points after serum treatment, the phosphorylation and total protein levels of STAT3 were detected by Western blotting (upper panel). 5 μg of protein was loaded per lane. β-actin expression was used as a control. Intensities of signals from phospho-STAT3 and total STAT3 were quantified by NIH-Image software. Quantifications of the reduction rate of phospho-STAT3 at each time point were shown (lower panel). C, The phosphorylation level of STAT3 in A375SM cells transfected with sifad104-A. The level of phosphorylation and total protein level of STAT3 were detected by Western blotting (upper panel). 5 μg of protein was loaded per lane. β-actin expression was used as a control. Intensities of signals from phospho-STAT3 and total STAT3 were quantified by NIH-Image software. Quantification of the promotion rate of phospho-STAT3 was shown (lower panel). D, The phosphorylation level of STAT3 in fad104 knockdown A375SM cells after treatment with medium containing 5% FBS. At indicated points after serum treatment, the level of phosphorylation and total protein level of STAT3 were detected by Western blotting (upper panel). 5 μg of protein was loaded per lane. β-actin expression was used as a control. Intensities of signals from phospho-STAT3 and total STAT3 were quantified by NIH-Image software. Quantifications of the promotion rate of phospho-STAT3 at each time point were shown (lower panel). E, A375SM cells were transfected with 4xM67-tk-Luc luciferase reporter plasmid, in the presence or absence of Myc-tagged FAD104 expression plasmid. At 16 hours after transfection, the cells were starved for 4 hours and then incubated in the presence or absence of 5% FBS or IL-6 for 4 hours. The cell lysates were prepared and subjected to a luciferase assay. Luciferase activity was normalized to the β-gal activity. The relative luciferase activity was calculated from the mean value relative to control (leftmost lane), set as 1. Each column represents the mean with standard deviation (error bars) (n = 3). *p < 0.05, **p <0.01. Each Western blot shows the representative results in at least three independent experiments. Original uncropped images of blots are shown in Figure H in S1 File.

