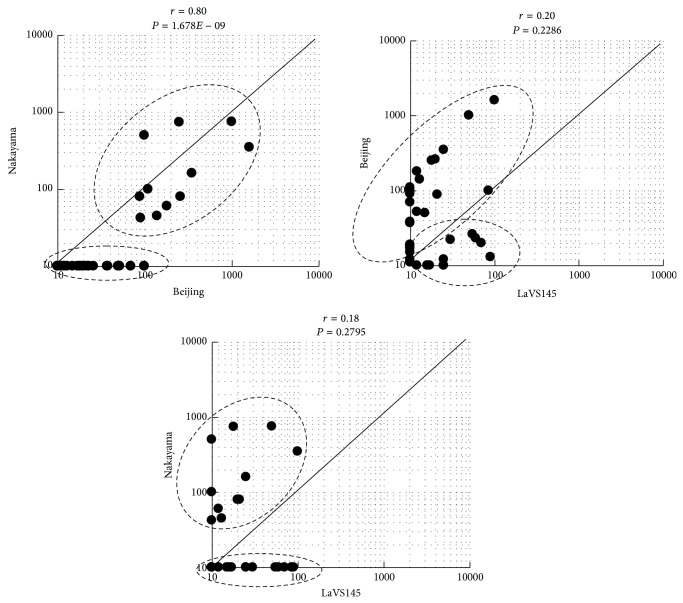
Figure 4.
Correlation graphs of neutralizing antibody titers against three strains of Japanese encephalitis virus in children in Vientiane in 1994, between JEV strains. The x- and y-axes show neutralization titers against each strain. The correlation coefficient is described as an r value. The result of a t-test for each correlation coefficient is shown as a P value.

