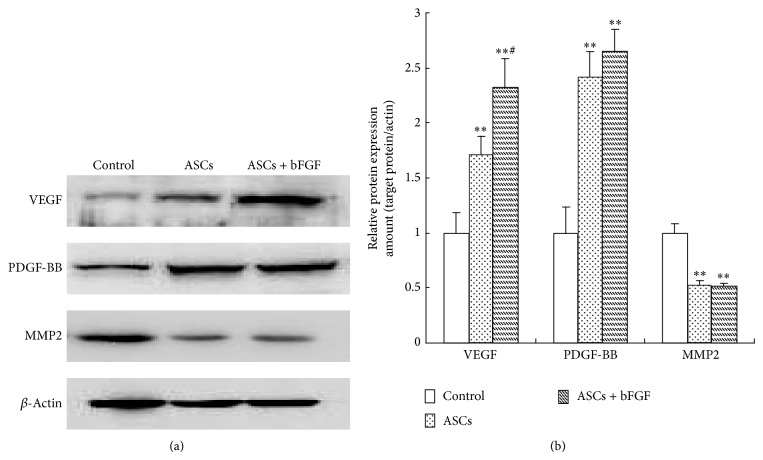
Figure 4.
(a) Western blotting analysis of the expression of VEGF, PDGF-PP, and MMP2 in fat grafts. (b) Quantitative analysis of protein levels by densitometry. The data from western blot were normalized by taking the value of control group as 1. ** P < 0.01 versus control group; # P < 0.05 versus ASCs group.

