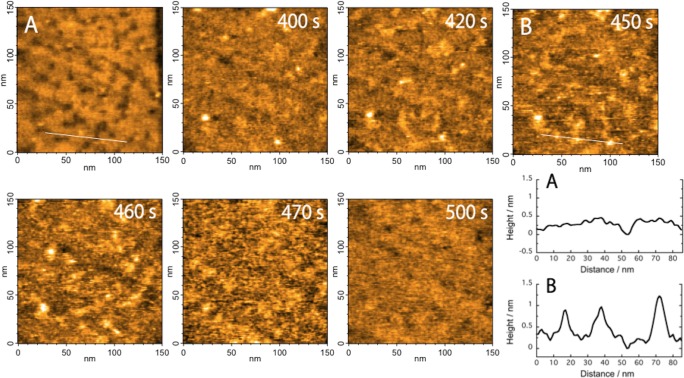
Figure 1. AFM images show (A) the MUA-modified gold surface and (B) cyt c adsorbed on the MUA SAM at 450 sec.
Continuous AFM images of adsorbing cyt c molecules with real-time labels. Frame rate, 2 frames/s; image area, 150 × 150 nm2. The cross sections of the images in (A) and (B), along the short white line, are shown in the lower right.

