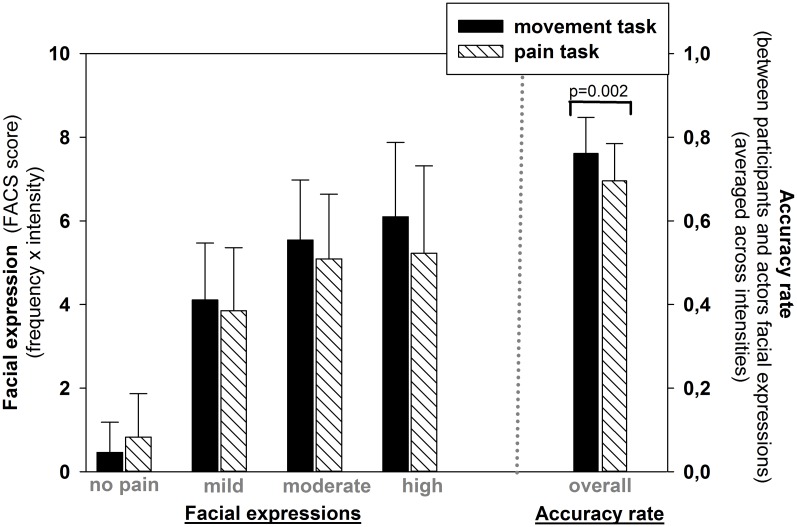
Fig 2. Results of FACS analysis of facial expressions.
(A) Facial response, by intensity level, during subject responses. Results of FACS analysis of facial expressions shown by participants for different pain intensity levels, during response phase of both movement task and pain task conditions. ANOVA confirmed a main effect of pain levels (p < 0.001) but no significant effect of, or interaction with, task (p > 0.05). (B) Facial response accuracy. Facial responses displayed by the participants were more similar to those in the target expressions in the movement task condition, vs the pain task condition (p = 0.002).

