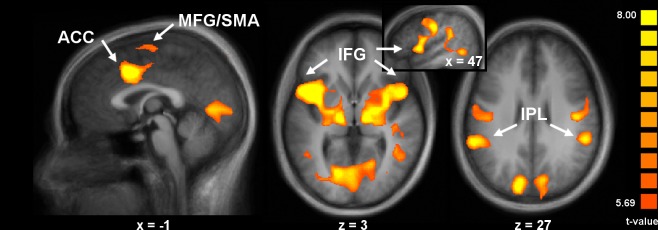
Fig 3. Areas commonly activated during observation and execution phases of the pain task (Obs∩Exec(PT)).

Significant clusters are shown in the mACC, the SMA, IFG/aINS, and IPL (p < 0.001, uncorrected). Inset figure shows rostral-caudal extent of activation in the right IFG. See Table 2 for coordinates and peak t-values.
