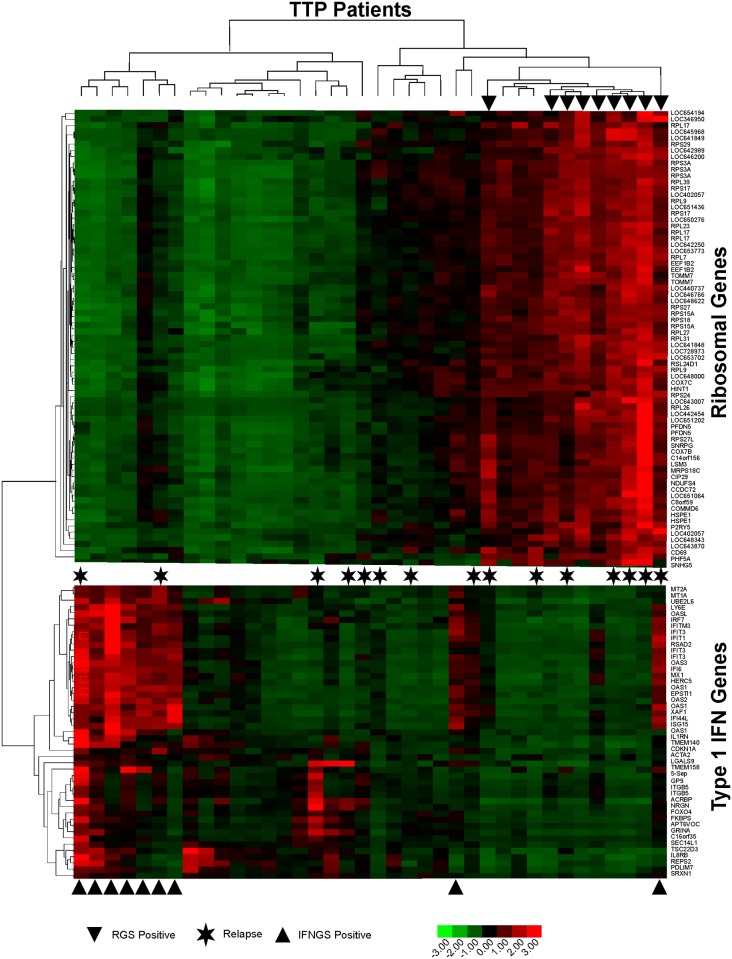
Fig 1. Heatmap of gene signatures present in peripheral blood of ADAMTS13-deficient TTP patients in remission.
Transformed expression levels of hypervariably expressed genes from the peripheral blood of ADAMTS13-deficient TTP patients were subjected to unsupervised clustering, revealing two predominant gene signatures. Arrowheads above the charts indicate samples that were classified as positive for a ribosomal gene signature, and arrowheads below the charts indicate samples that were classified as positive for a type I IFN gene signature. Asterisks indicate patients who had experienced at least one relapse. Data were transformed to the same scale ranges, making average expression over samples of zero and standard deviation of 1.0 for each gene. Colors indicate increased expression (red) or decreased expression (green).

