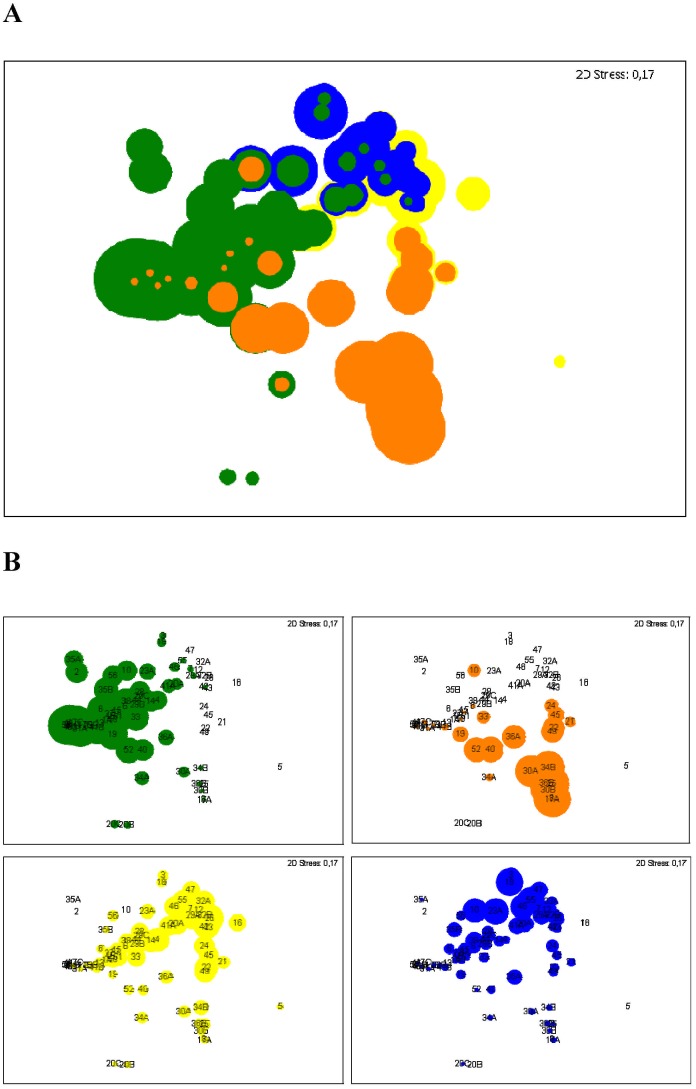
Fig 1. Multidimensional Scaling (MDS) plots from bacterial community composition observed in 72 sputum samples.
Bubbles indicate relative abundances of the 4 most prevalent OTUs in the cohort: P. aeruginosa in green, S. aureus in orange, alpha-hemolytic Streptococcus (Streptococcus -1) in yellow, R. mucilaginosa in blue. 2D Stress values are given in each plot and reveal moderate stress. (A) Merged bubble plots from all four dominant OTUs, coloured bubbles indicating the individual abundances. P. aeruginosa as well as S. aureus have priority, whereas the abundances for R. mucilaginosa and alpha-hemolytic Streptococcus are in the background. (B) Individual MDS plots for each dominant OTU. Numbers indicate individual patients. Letters are according the order of sputum collection.

