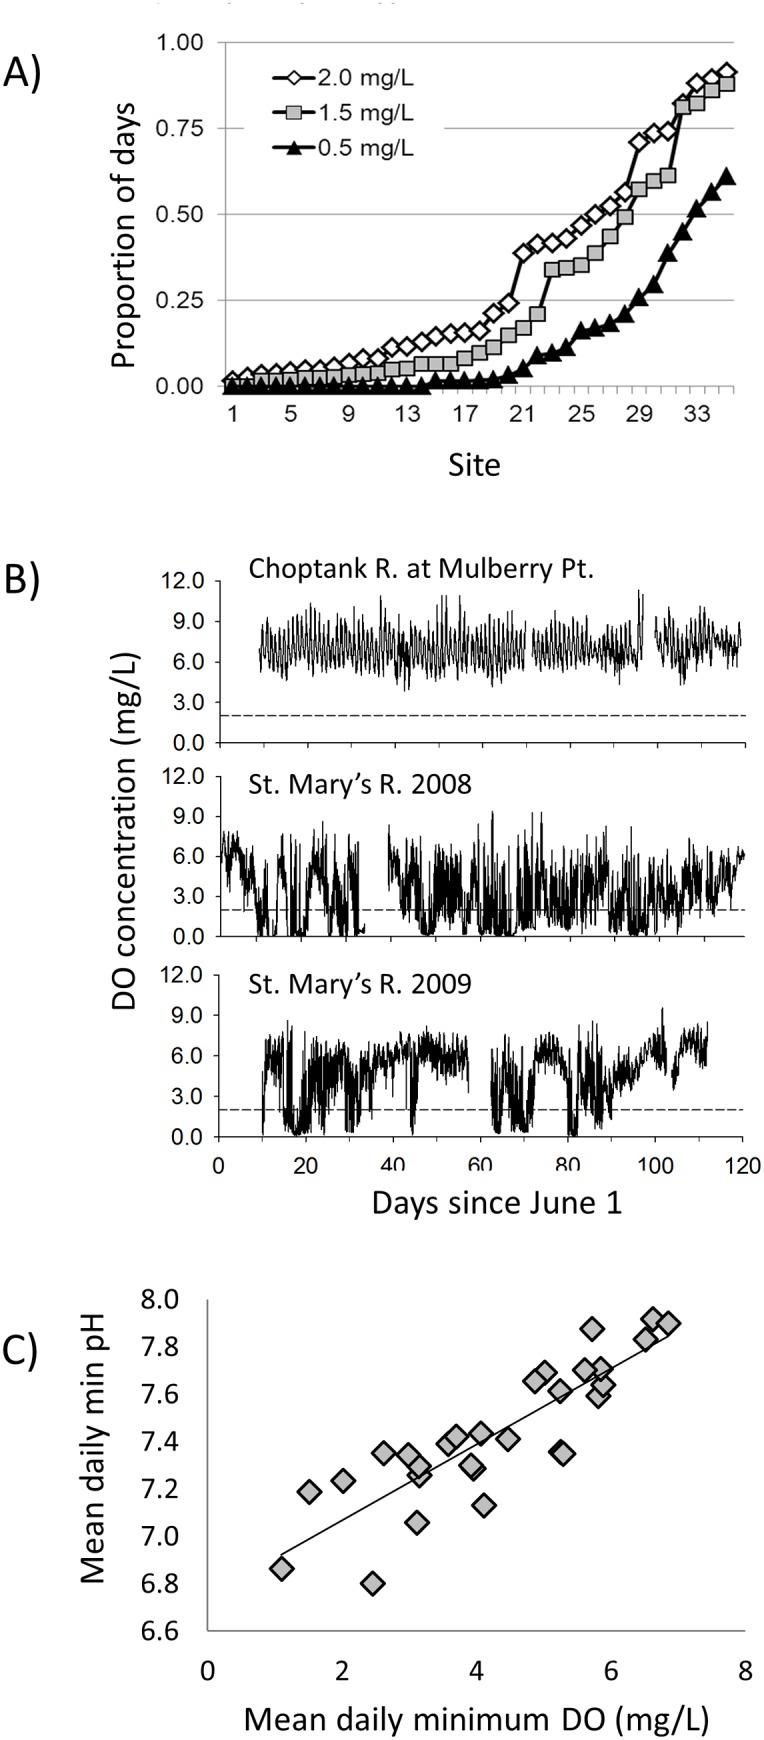
Fig 1. Patterns of diel-cycling dissolved oxygen concentrations in shallow (<2m) water in Chesapeake Bay and Maryland coastal bays.

(A) Proportion of days during July and August with minimum DO concentrations ≤2.0, 1.5 and 0.5 mg l-1 at 36 sites with mean summer salinity ≤7.0 that were monitored ≤0.5 m above the bottom between 2001 and 2012. Note that site numbers do not correspond to field experiment sites and are used only to order the sites from least to most frequent hypoxia. (B) DO concentrations at two of the field deployment sites. DO concentrations at Mulberry Pt. always remained above 50% saturation. In contrast DO periodically dropped below 0.5 mg l-1 at the St. Mary’s R. site, and had a higher frequency of days with DO <0.5 mg l-1 in 2008 than in 2009. The reference line at 2.0 mg l-1 indicates conditions typically considered hypoxic, although many organisms experience negative effects at higher oxygen levels. (C) Relationship between mean daily minimum DO and mean daily minimum pH at the 29 sites with at least 20d of monitoring for both parameters.
