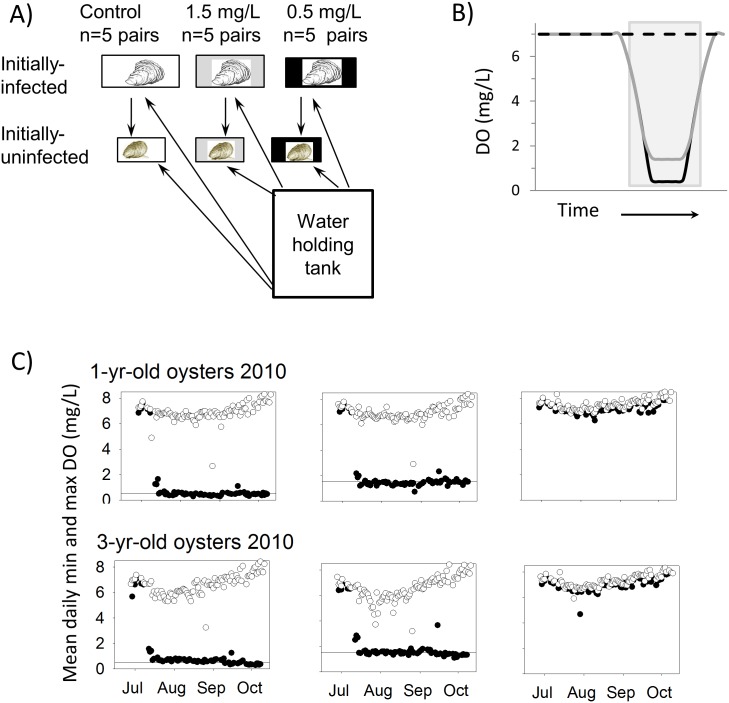
Fig 3. Laboratory experiment.
(A) Experimental treatments. Arrows indicate direction of water flow. (B) Idealized dissolved oxygen cycle in experiments. Dashed black line = high DO control treatment; grey line = 1.5 mg l-1 treatment; black solid line = 0.5 mg l-1 treatment. The grey shaded box indicates the dark period. (C) Daily minimum (black circles) and maximum (open circles) dissolved oxygen concentrations measured in experiment tanks for each treatment in 2010. Horizontal lines indicate target DO concentrations in the 2 diel-cycling hypoxia treatments.

